

India's Q3 GDP 2026: Festive Spending & Economic Insights
Explore India's Q3 GDP, festive spending impact, and FY27 indicators. See how Diwali and harvest seasons drive growth.
India's Q3 GDP covers October through December. It's the festive quarter and the reason it matters more than other quarters is that Diwali spending, kharif harvest money flowing into rural households, and government departments burning through their budgets before March all hit at roughly the same time.
For FY27, that's October to December 2026. Early signs suggest the economy kept moving after Q1's 6.7% print, but we won't have a clear picture until the official number lands.
This content is for informational purposes only and does not constitute financial, legal, or investment advice.
Understanding the Q3 cycle
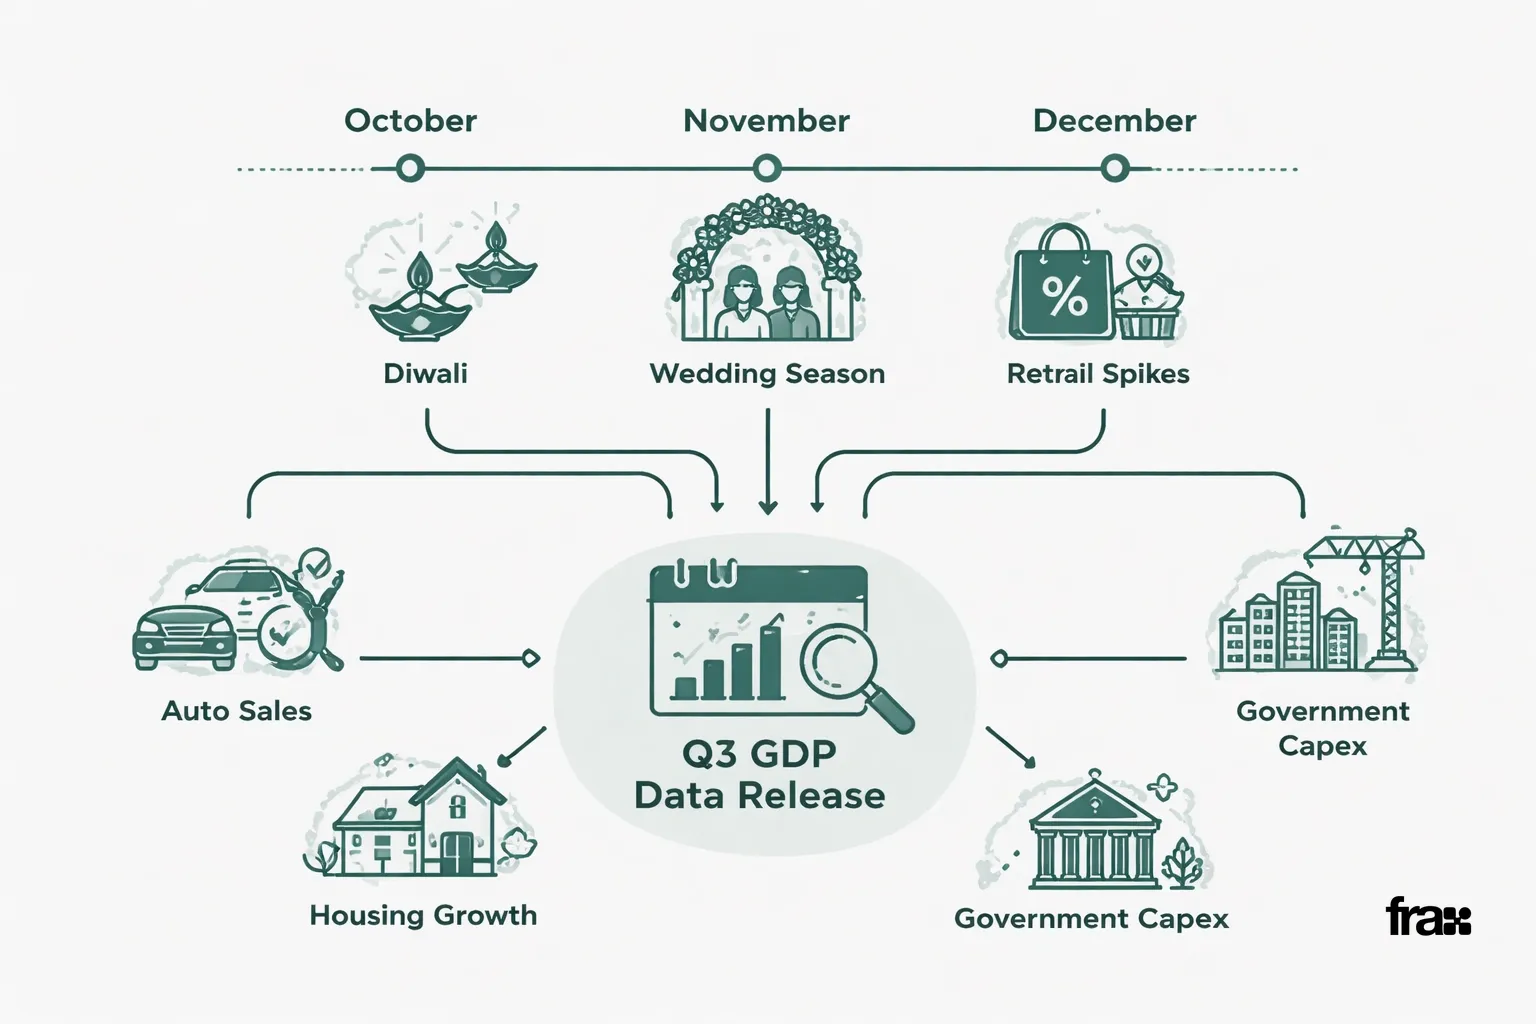
Q3 runs October through December. Diwali. Wedding season. Consumption spikes compared to Q2 almost every year retail, auto, and housing all see their best numbers in this window. Government capex also picks up as ministries rush to hit annual targets before the fiscal year closes.
The Ministry of Statistics and Programme Implementation puts out the provisional Q3 estimate about two months after the quarter ends. Q3 FY27 data (October-December 2026) should arrive around late February 2027. This number often shifts how full-year growth gets revised, which is why markets watch it closely.
A few structural factors define this quarter, year after year:
Festive demand lifts discretionary spending across urban and semi-urban markets.
Rural income rises as kharif crop sales reach mandis and farmers get paid out.
Government departments front-load capital expenditure before the fiscal year's final stretch.
These patterns make Q3 a decent barometer for domestic demand, apart from the export-driven or investment-led growth you see elsewhere.
Q3 FY27: what the early data says
This content is for informational purposes only and does not constitute financial, legal, or investment advice.
Q3 FY27 looks like it could track the Q1 momentum. High-frequency indicators GST collections, auto sales, credit growth suggest consumption held up through the festive window. I'd take that with a grain of salt until the official print confirms it, though.
The data coming out of October and November 2026 gives analysts a preview. GST collections during the festive stretch usually rise sharply, feeding directly into private consumption estimates. Passenger vehicle sales, a reasonable proxy for middle-class confidence, also tend to spike.
Economists build Q3 forecasts using a handful of indicators:
Indicator | What It Signals |
|---|---|
GST collections | Consumption and formal economy activity |
Core sector output | Industrial and infrastructure momentum |
PMI (Manufacturing & Services) | Business sentiment and order books |
Credit growth | Household and business borrowing appetite |
Rural wage data | Agricultural income and rural demand |
For context on how we got here, the Q1 GDP growth implications piece breaks down the 6.7% print in detail.
Q3 is a consumption quarter. Unlike Q1 or Q4, which ride on investment cycles and export orders, Q3 runs on domestic spending tied to festivals and harvests. Festive consumption alone can move the quarterly number meaningfully. Retailers and e-commerce platforms see their highest sales volumes here. Auto dealerships, jewellery retailers, real estate developers they all time launches to catch the surge.
Government capex plays a supporting role. Ministries accelerate spending on roads, railways, and housing as the fiscal year winds down, and that ripples through construction, logistics, and related sectors.
Agriculture contributes differently. The kharif harvest, sold through October and November, puts cash in rural households right before festive spending starts. More on this in the primary sector and GDP impact article.
See How Real Estate Fits Into India's Growth Story
How Q3 stacks up against the rest of the year
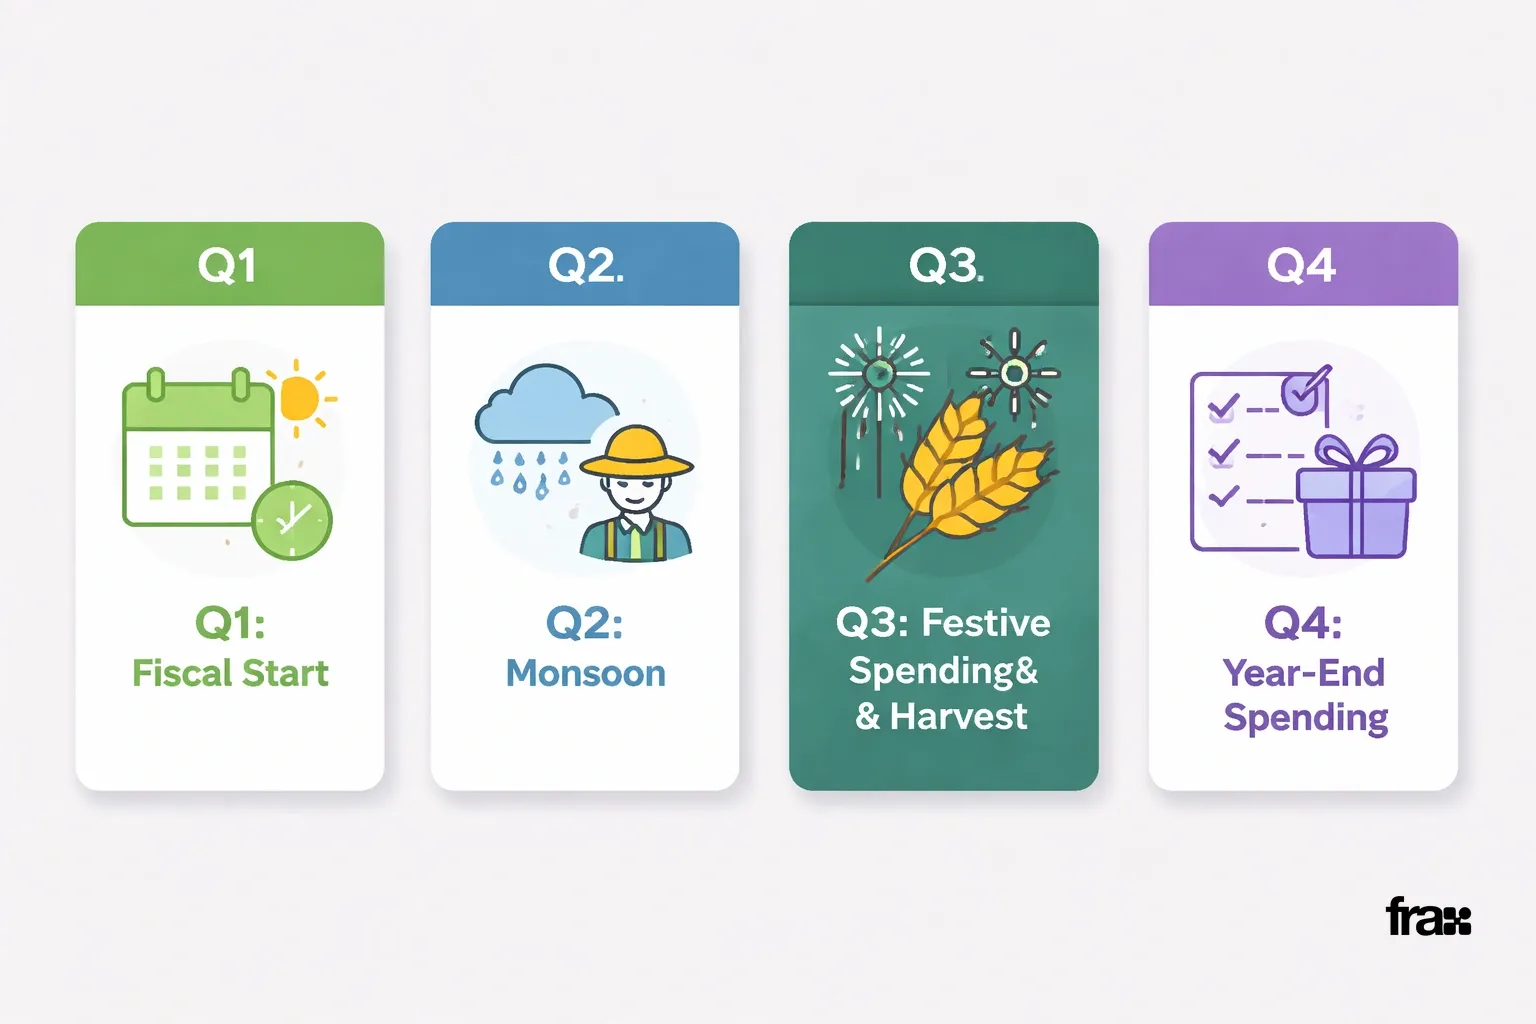
Q3 doesn't behave like the other quarters because its seasonal mix is different. Q1 (April-June) is the fiscal year starting up plus early monsoon. Q2 (July-September) is shaped by monsoon-dependent agriculture. Q4 (January-March) is the year-end government and corporate push.
Quarter | Months | Primary Growth Driver |
|---|---|---|
Q1 | April-June | Early fiscal year activity, summer demand |
Q2 | July-September | Monsoon-linked agriculture, rural sentiment |
Q3 | October-December | Festive consumption, kharif harvest sales |
Q4 | January-March | Year-end government spending, corporate closures |
This is also why economists don't compare Q3 directly with Q2 without adjusting for seasonality. A longer historical view is in the GDP growth from 2014 to 2026 overview.
This content is for informational purposes only and does not constitute financial, legal, or investment advice.
Which sectors carry Q3
Q3 usually favours trade, hotels, transport, and construction over heavy industry. These sectors soak up the festive and travel spending. Manufacturing moves steadily but rarely jumps the way consumption-linked services do here.
Construction is the one I'd watch. It responds to both the government infrastructure push and private housing demand, and developers time project launches to catch peak Diwali sentiment. The state-wise GDP growth analysis breaks down how regional construction activity varies.
Services trade, hospitality, transport usually post the strongest quarter-on-quarter jump. Travel bookings, retail footfall, logistics volumes. Financial services get a bump too, since credit disbursement for consumer purchases rises sharply in October and November.
How the data gets measured and released
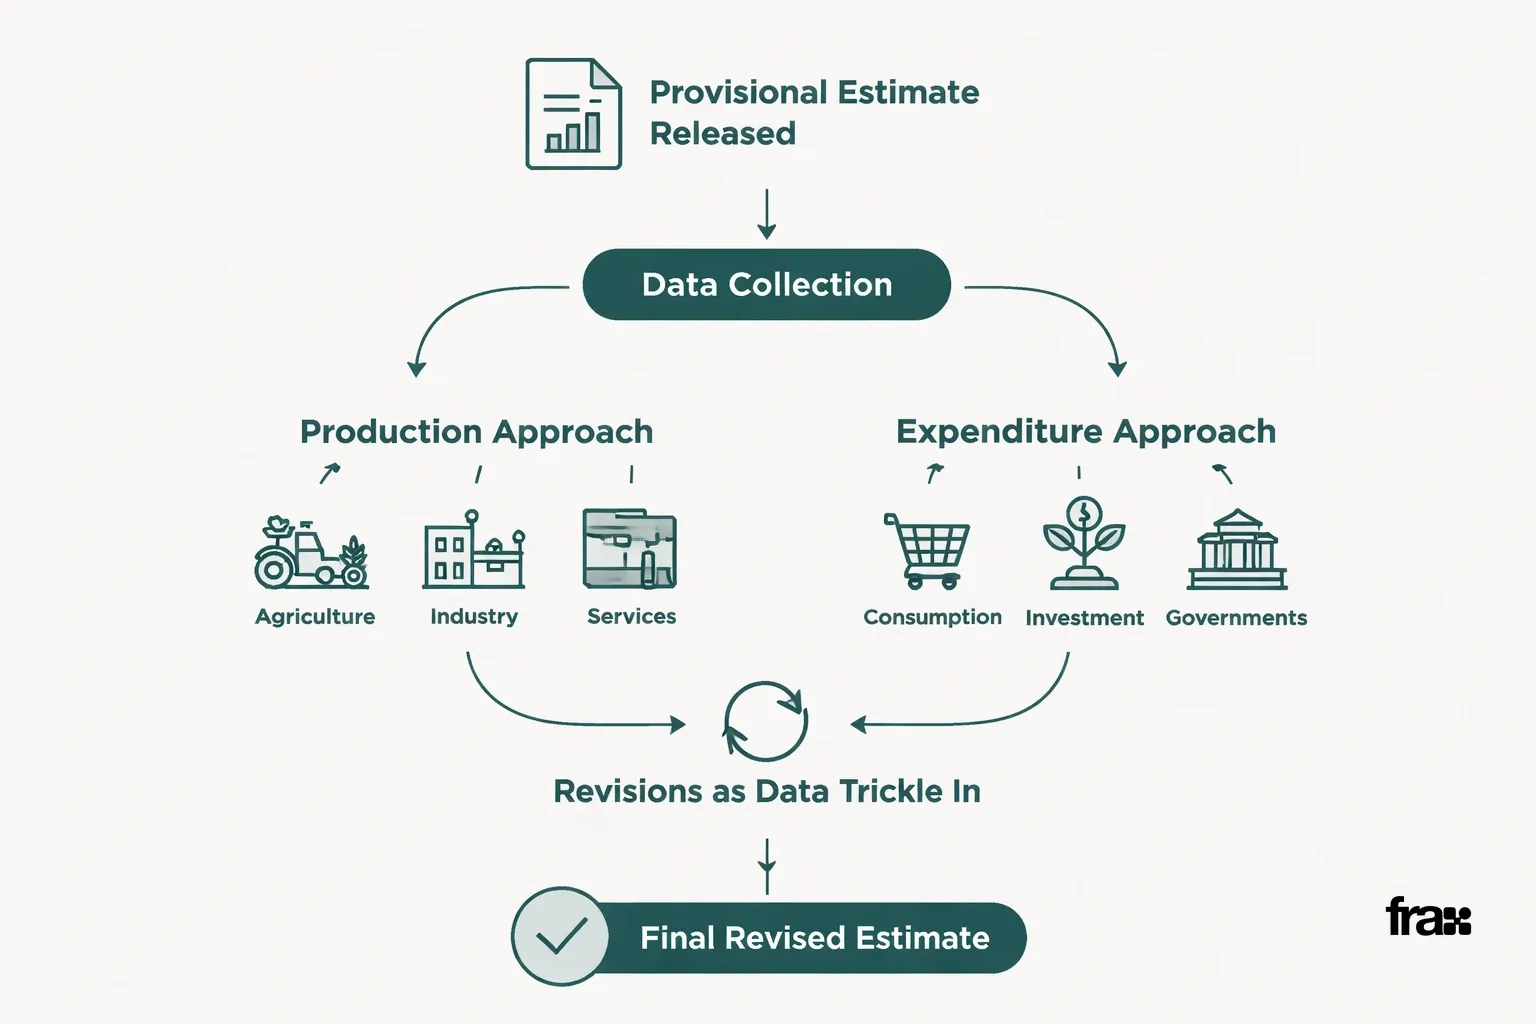
The National Statistical Office compiles Q3 GDP using production-side and expenditure-side methods. Provisional estimate first. Revisions follow as fuller data trickles in. Early headlines sometimes get corrected months later which is frustrating if you already made decisions based on the first number.
The production approach measures output across agriculture, industry, and services, drawing on data from ministries, industry bodies, and surveys. The expenditure approach tracks consumption, investment, government spending, and net exports. Both should theoretically land at similar totals, but gaps are common.
I'd treat the first provisional number as directional, not gospel. Revisions can shift the picture by half a percentage point or more. That's why policymakers track multi-quarter trends rather than reacting to a single print: something we get into more in the GDP growth journey from 1947 to 2026.
This content is for informational purposes only and does not constitute financial, legal, or investment advice.
What it means if you're an everyday investor
A strong Q3 reinforces positive sentiment heading into the final quarter. A weak one makes lenders and investors cautious. But a single quarterly number really shouldn't drive major portfolio decisions. The trend across multiple quarters tells you more about whether the economy is genuinely accelerating or just had a good season. If short-term volatility worries you, the economic slowdown investment strategies guide walks through some practical approaches.
Diversified, smaller-ticket investments can smooth out the noise from quarterly GDP swings. FraX lets you start with ₹10,000 and build exposure gradually rather than trying to time a single data release. If you're new to this, the guide on how fractional real estate works and 10 practical investing tips for 2026 are decent starting points.
Start Building Wealth With FraX Today
For a broader view of how quarterly data fits into India's economic and real estate story, visit the economic growth and real estate outlook hub. You can also browse the FraX blog or learn about the platform at getfrax.com.
This content is for informational purposes only and does not constitute financial, legal, or investment advice. Investors hold direct beneficial partnership interests in dedicated LLP SPVs, not direct individual property titles. Past performance and realized XIRR figures are historical and do not guarantee future property returns or rental yields.
## Frequently Asked Questions
Q: When does India's Q3 GDP growth data get released? A: Q3 covers October to December. The provisional estimate usually lands about two months later, typically late February.
Q: Why does Q3 GDP growth often look different from Q2? A: Completely different seasonal drivers. Q3 runs on festive spending and harvest income. Q2 depends on monsoon-linked agriculture. They're not really comparable without seasonal adjustment.
Q: Which sectors usually grow fastest in Q3? A: Trade, hotels, transport, and construction. All of them are driven by festive spending, travel, and project launches timed around Diwali.
Q: How reliable is the first Q3 GDP growth estimate? A: Not very. It's directional. Subsequent revisions can shift the figure by half a percentage point or more once fuller data comes in.
Q: Does Q3 GDP growth affect real estate demand directly? A: Festive sentiment definitely lifts property inquiries and launches. But GDP growth alone doesn't guarantee price appreciation for any specific asset that depends on location, project quality, and a dozen other things.
Q: How can investors respond to GDP growth announcements without overreacting? A: Look at multi-quarter trends, don't fixate on one print. Diversified, smaller-ticket positions help buffer the noise so short-term GDP swings don't knock your long-term goals off track.
Learn more
Discover more from the latest posts.


