India's State GDP Growth 2026: Real Estate Insights
Explore India's 2026 state GDP growth trends and their impact on real estate. Discover investment opportunities in high-growth regions.
The national GDP number gets all the attention, but it's mostly a blur. It hides the real story: growth in India isn't evenly distributed. It's clustering.
While the national figure sits in a predictable range, states like Gujarat, Karnataka, and Telangana are consistently beating the india gdp growth rate. Others are stuck. The gap comes down to infrastructure, industrial mix, and how fast state governments can actually get things built.
If you're tracking where capital, jobs, and real estate demand are headed, you have to look past the national average. This piece breaks down which states are actually driving india gdp growth in 2026, why the divergence is widening, and what that means for where you put your money. For a broader view of how this connects to property markets, our companion piece on India's Economic Growth and Real Estate Outlook is worth a read.
This content is for informational purposes only and does not constitute financial, legal, or investment advice.
What Is India's GDP Growth Rate in 2026
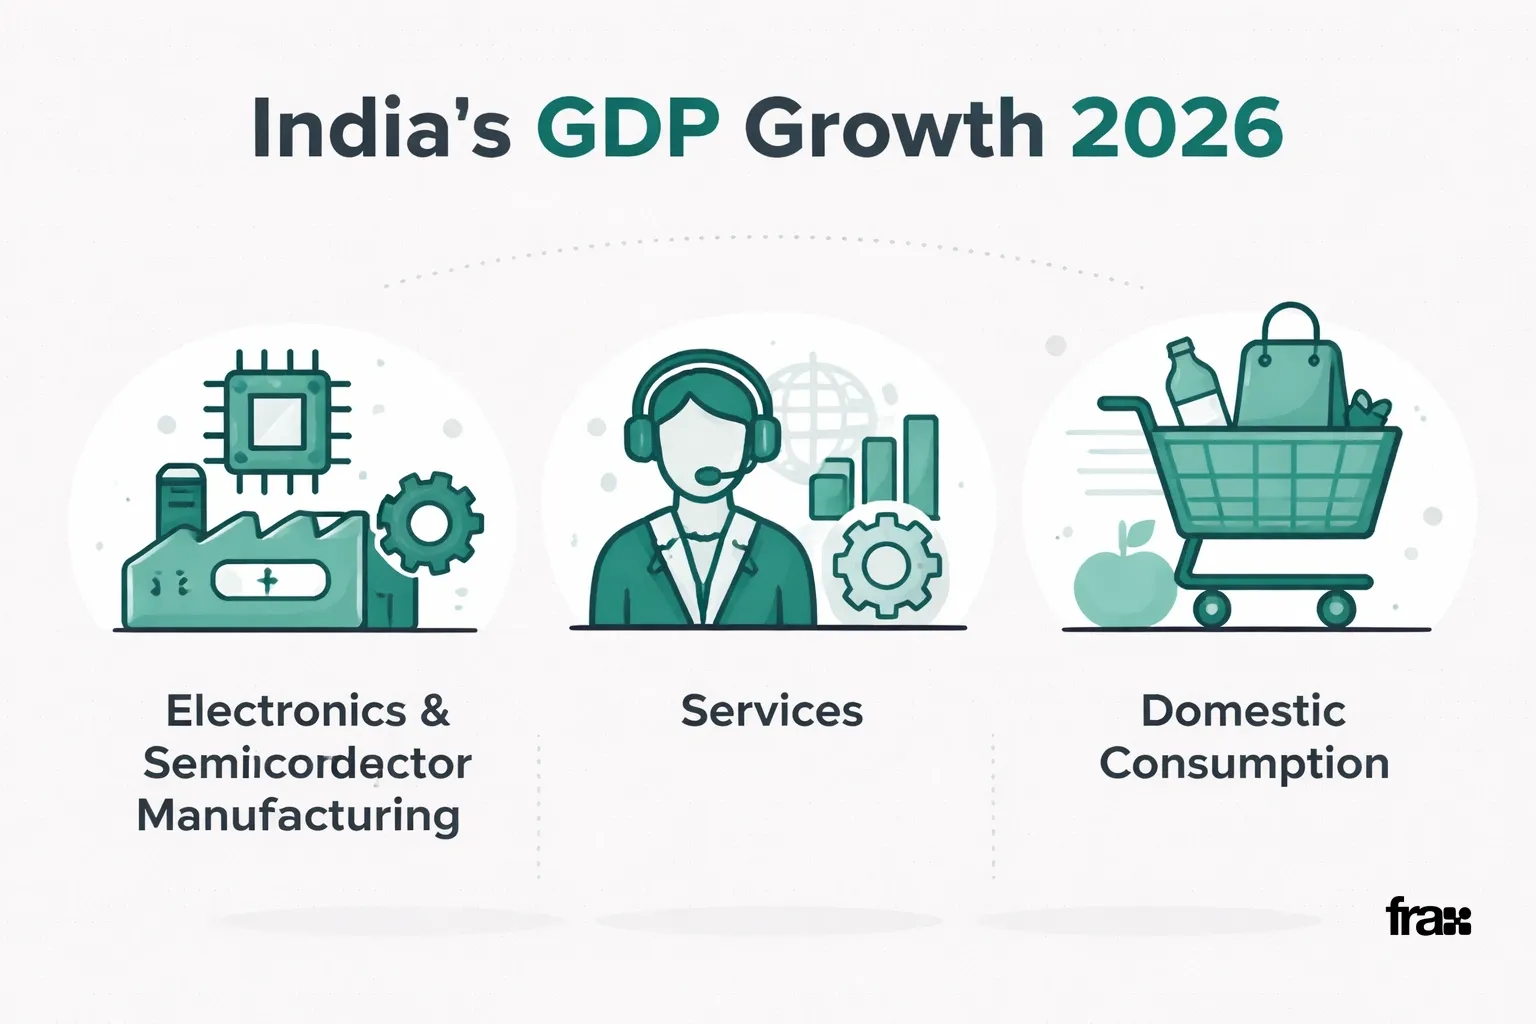
India's GDP growth rate is just the annual percentage increase in total economic output. Through 2026, India is still one of the fastest-growing large economies. The engine is services, manufacturing, and domestic consumption.
But "national GDP" is a weighted average of economies that look nothing like each other. Some states punch above their weight because they have ports, factories, or IT hubs. Others drag the average down. That's why investors who only watch the headline number miss where the actual momentum is.
What's pushing india gdp growth this year:
Electronics and semiconductor manufacturing is finally scaling
IT services exports are rising, mostly from the south
Consumption in tier-2 and tier-3 cities is picking up
The government is spending heavily on highways and logistics
Financial services and fintech adoption are still growing fast
This content is for informational purposes only and does not constitute financial, legal, or investment advice.
State-Wise GDP Growth: The Real Picture
There is a hard line between states that are urbanized and industrialized and those that are still catching up. Western and southern states almost always post growth above the national average. Several northern and eastern states grow slower, population size notwithstanding.
This isn't a new trend. Gujarat and Maharashtra have led on industrial output for years. Karnataka, Tamil Nadu, and Telangana dominate services and IT. Bihar and Jharkhand trail the national average on per-capita income, even if their percentage growth sometimes looks decent on paper.
In 2026, a few things stand out:
Southern states are pulling ahead on services
Western states still dominate manufacturing
Northern states are improving, but mostly because of infrastructure spend
Eastern states are growing, but from a low base
This content is for informational purposes only and does not constitute financial, legal, or investment advice.
Fastest-Growing Indian States Driving GDP Growth
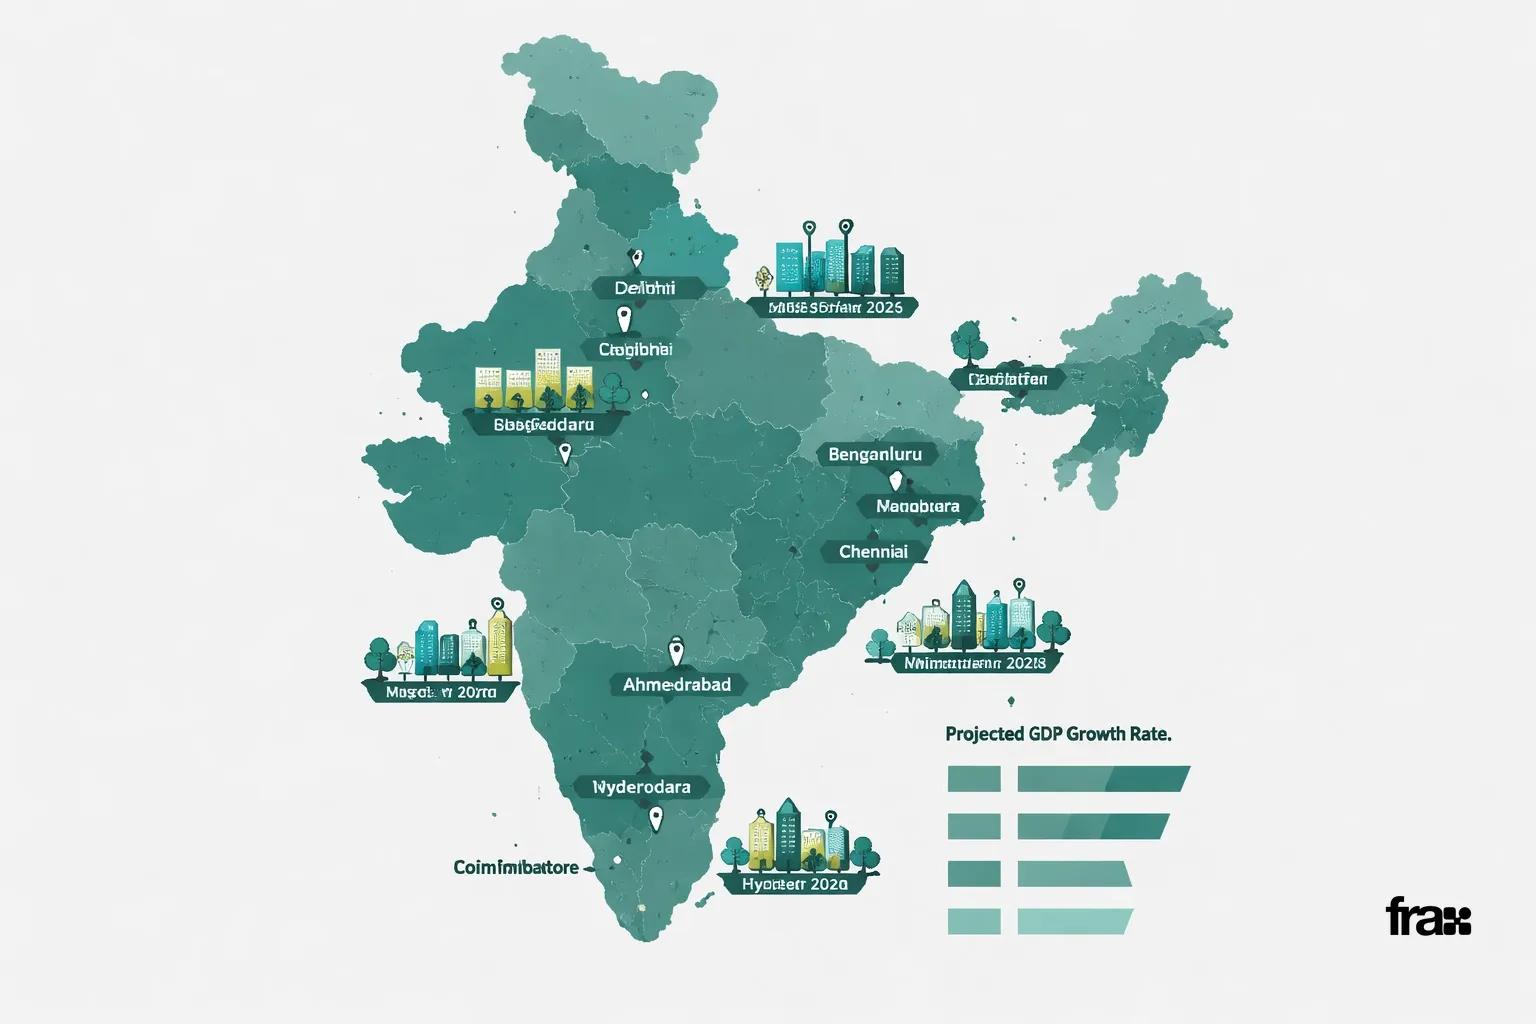
The states growing fastest in 2026 share two things: decent urban infrastructure and a mix of industries. States reliant on a single sector tend to see growth swing wildly year to year.
The geography of growth is also shifting. Ten years ago, it was locked to the big metros. Now, secondary cities Coimbatore, Nagpur, Vadodara are adding serious output. This spread is a big reason india gdp growth hasn't collapsed despite global headwinds.
This content is for informational purposes only and does not constitute financial, legal, or investment advice.
See where growth is heading, start investing with FraX
Table: GDP Growth Trends by State Category
The table below groups states by character, not exact quarterly figures. Government numbers get revised constantly, so look at the direction, not the decimal points.
State Category | Representative States | Primary Growth Driver | Growth Character |
|---|---|---|---|
High-growth industrial | Gujarat, Maharashtra | Manufacturing, exports, ports | Consistently above national average |
High-growth services | Karnataka, Telangana, Tamil Nadu | IT, services, urban consumption | Strong, services-led |
Steady mid-growth | Uttar Pradesh, Rajasthan, Madhya Pradesh | Infrastructure, agriculture, retail | Improving, still catching up |
Emerging growth | Odisha, Andhra Pradesh | Mining, manufacturing, ports | Gaining momentum |
Slower growth | Bihar, Jharkhand | Agriculture, remittances | Below national average |
Note: This is directional. Always verify with official state and central government releases before making investment decisions.
This content is for informational purposes only and does not constitute financial, legal, or investment advice.
Why India GDP Growth Varies So Much Across States
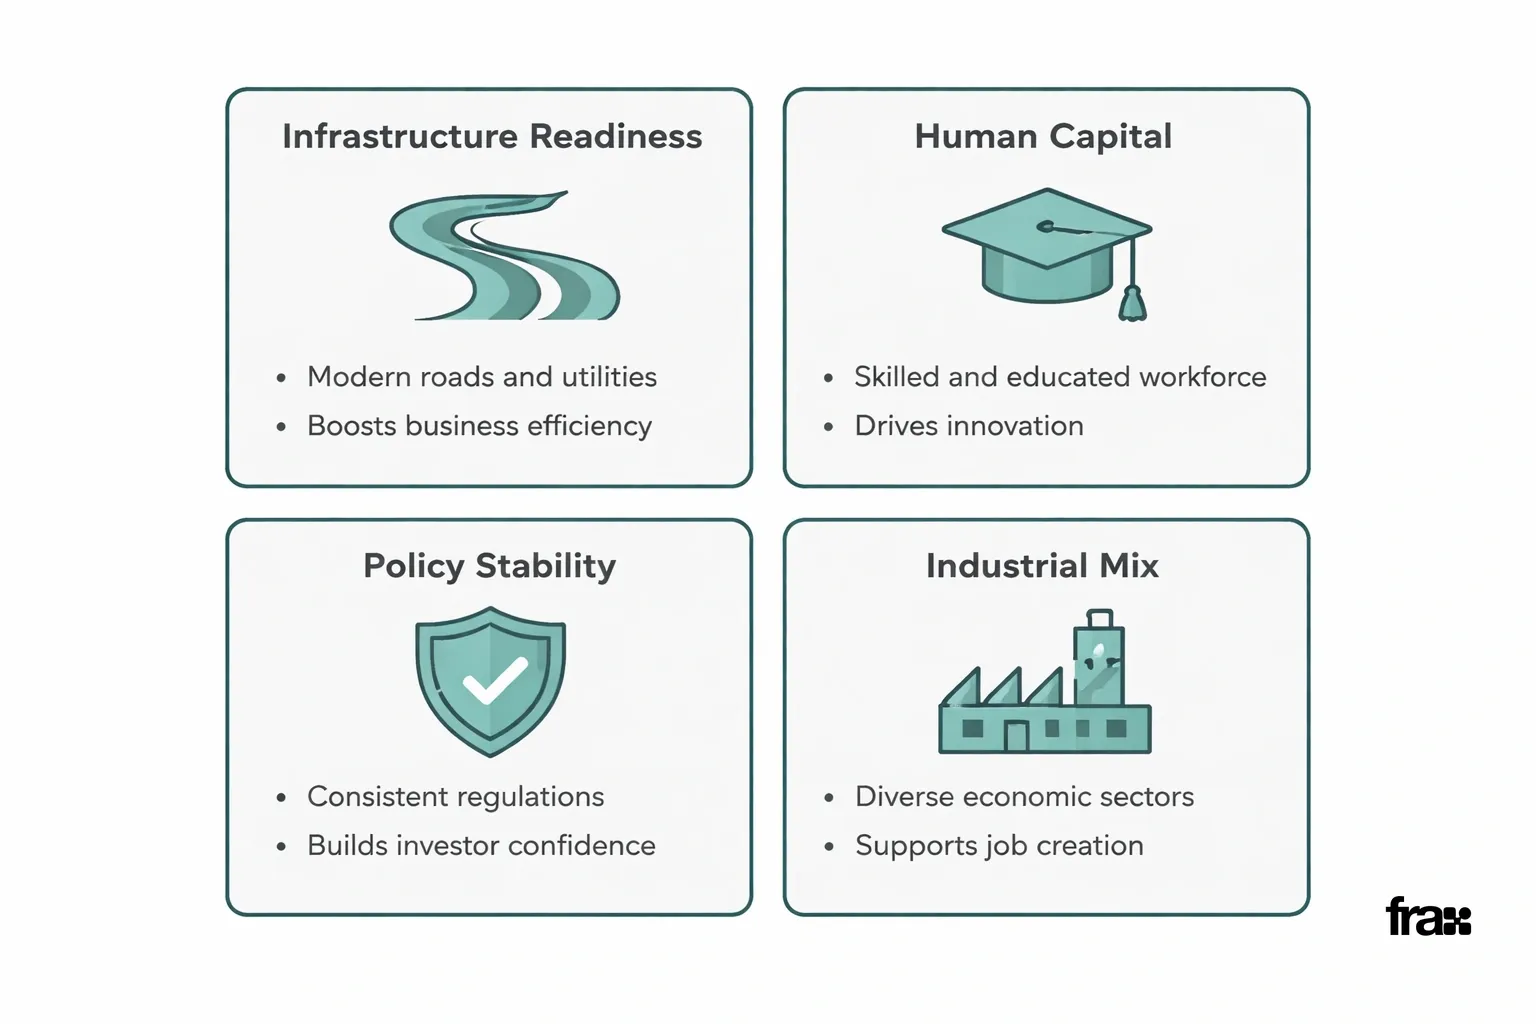
It mostly comes down to three things: infrastructure, industrial mix, and human capital. States with better roads, ports, and digital networks attract private capital. That capital compounds.
The structural gaps:
Infrastructure readiness: If you have highways and ports, you get factories and warehouses. If you don't, you don't.
Human capital: States with strong technical education get IT and services firms. Others don't.
Policy stability: Investors go where rules don't change every election cycle.
Real estate demand follows this logic closely. Job creation drives migration. Migration drives housing demand. Property values in high-growth states rise faster because people are actually moving there. We break this down further in our piece on top cities for fractional real estate investment in India 2026.
This content is for informational purposes only and does not constitute financial, legal, or investment advice.
What India GDP Growth Means for Real Estate Investors
This content is for informational purposes only and does not constitute financial, legal, or investment advice.
State-level GDP growth is a proxy for where demand is concentrating. States growing faster than the national average create more jobs, pull in more migrants, and support rental markets.
This isn't a guarantee of returns. Local supply, regulations, and pricing matter. But as a macro filter, it tells you where the tailwinds are.
For investors connecting macro trends to actual portfolios, it helps to understand how fractional real estate investing works in India. Investors hold direct beneficial partnership interests in dedicated LLP SPVs, not direct individual property titles. Betting on a single state is risky. Spreading exposure across high-growth cities is usually safer.
Explore FraX opportunities in India's fastest-growing markets
How to actually track this:
Read state budget announcements look for line items on infrastructure
Watch migration data into tier-1 and tier-2 cities
Check RBI and Ministry of Statistics releases quarterly
Compare state growth trends against your current holdings
If you're comparing structures, our guide on REITs versus fractional ownership versus direct property investment is a solid companion read.
How to Track India GDP Growth Data Going Forward
The Ministry of Statistics and Programme Implementation releases GDP data quarterly. State finance departments publish their own estimates. These are usually provisional and get revised later, so don't treat the first number as final.
The useful habit: check state GDP updates alongside city-level real estate trends every quarter. Together, they tell you much more than either dataset alone. Our broader India's economic growth and real estate outlook connects the dots.
Resources to bookmark:
Government of India official statistics
RBI state finance reports
Our beginner's glossary for fractional real estate investment useful when wading through macro jargon
The FraX blog for ongoing updates
If you want to see how this translates into actual deals, check the FraX homepage or reach out via the contact page.
This content is for informational purposes only and does not constitute financial, legal, or investment advice. Investors hold direct beneficial partnership interests in dedicated LLP SPVs, not direct individual property titles. Past performance and realized XIRR figures are historical and do not guarantee future property returns or rental yields.
Frequently Asked Questions
This content is for informational purposes only and does not constitute financial, legal, or investment advice.
Q: What is India's current GDP growth rate compared to individual states?
A: The national rate is an average. Gujarat, Karnataka, and Telangana often grow faster. Some northern and eastern states grow slower.
Q: Which Indian states have historically shown the fastest GDP growth?
A: Industrial states (Gujarat, Maharashtra) and services-heavy states (Karnataka, Tamil Nadu, Telangana) usually post above-average growth.
Q: Why do some Indian states grow faster than others?
A: Infrastructure quality, industrial base, workforce skills, and policy stability. It's structural.
Q: Where can I find official India GDP growth data by state?
A: Ministry of Statistics and Programme Implementation, state finance department reports, and RBI publications.
Q: How does state-level GDP growth affect real estate investing?
A: Faster growth usually means more jobs and migration, which supports housing and rental demand. But local factors still matter.
Q: Does high state GDP growth guarantee strong property returns?
A: No. It's a useful macro signal, but returns depend on local supply, pricing, and regulations.
Learn more
Discover more from the latest posts.