India's GDP Growth Journey 1947-2026 & Real Estate Insights
Explore India's GDP growth from 1947 to 2026 and its impact on real estate. Understand how economic shifts shape investment opportunities today.
India's GDP in 1947 was about $2.7 billion. One of the poorest large economies on earth at independence. Eight decades later, we're talking about a multi-trillion-dollar economy. That journey from 1947 to now explains why real estate and wealth-building look so different today.
If you're thinking about long-term investing, the history matters. It shows why premium assets, once locked away from ordinary earners, are finally opening up to a broader class of investors.
This content is for informational purposes only and does not constitute financial, legal, or investment advice.
The 1947 starting point
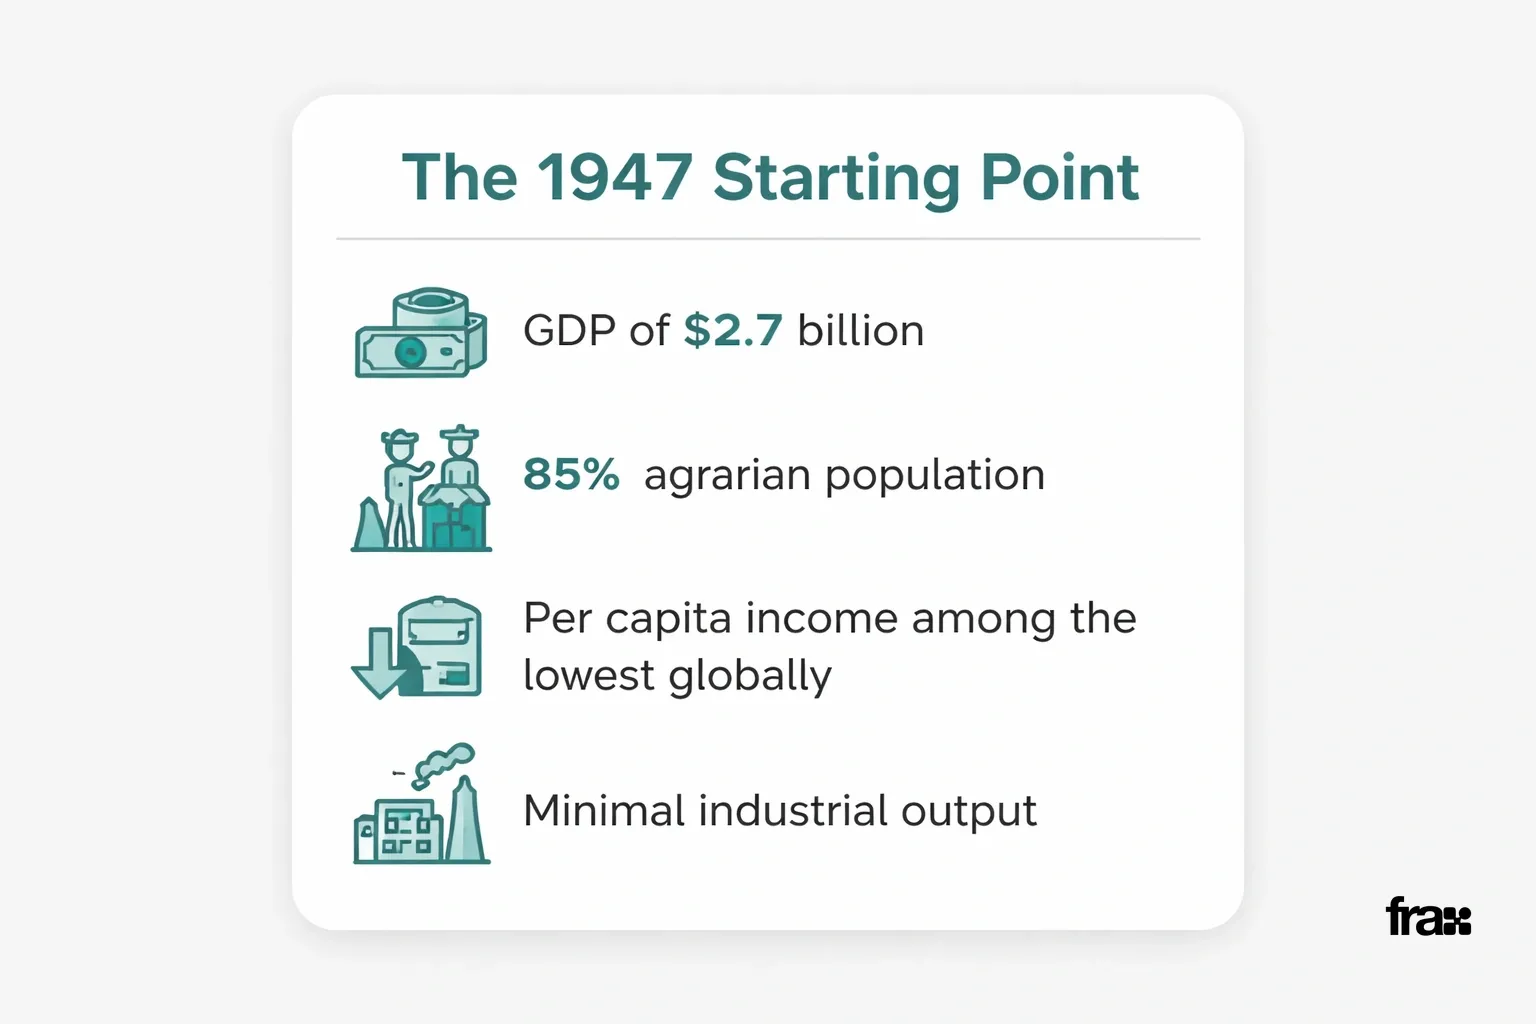
India's economy at independence was overwhelmingly agrarian. GDP near $2.7 billion. Per capita income among the lowest globally. Nearly 85% of the population depended on farming. Industrial output was minimal. Decades of colonial extraction had left infrastructure and capital formation far behind comparable economies.
Partition made everything harder. Supply chains broke. Resource-rich regions split. Millions of workers displaced overnight. Foreign exchange reserves were thin. Domestic savings rates hovered in the low single digits: almost no capital for industrial expansion.
This starting point frames every stage of India's GDP growth that followed. Planners inherited a fragile base and had to build institutions almost from scratch.
This content is for informational purposes only and does not constitute financial, legal, or investment advice.
Decades of slow growth: 1947 to 1991
This content is for informational purposes only and does not constitute financial, legal, or investment advice.
Between 1950 and 1980, India GDP growth averaged around 3.5% annually a pace economists later nicknamed the "Hindu rate of growth." Heavy state control, licensing regimes, and limited foreign trade kept expansion sluggish for three decades.
Five-year plans prioritized heavy industry and public sector enterprises. Steel, cement, and power generation expanded. Consumer industries stayed underdeveloped. Private capital faced strict licensing hurdles, discouraging entrepreneurship.
By the late 1970s, structural bottlenecks were obvious. Foreign exchange crises recurred. Import substitution policies protected domestic industry but reduced global competitiveness. India crawled while several East Asian economies accelerated past it.
Real estate during this period remained informal, cash-driven, and largely inaccessible to salaried professionals. Property ownership concentrated among landowning families and business elites.
1991: The turning point
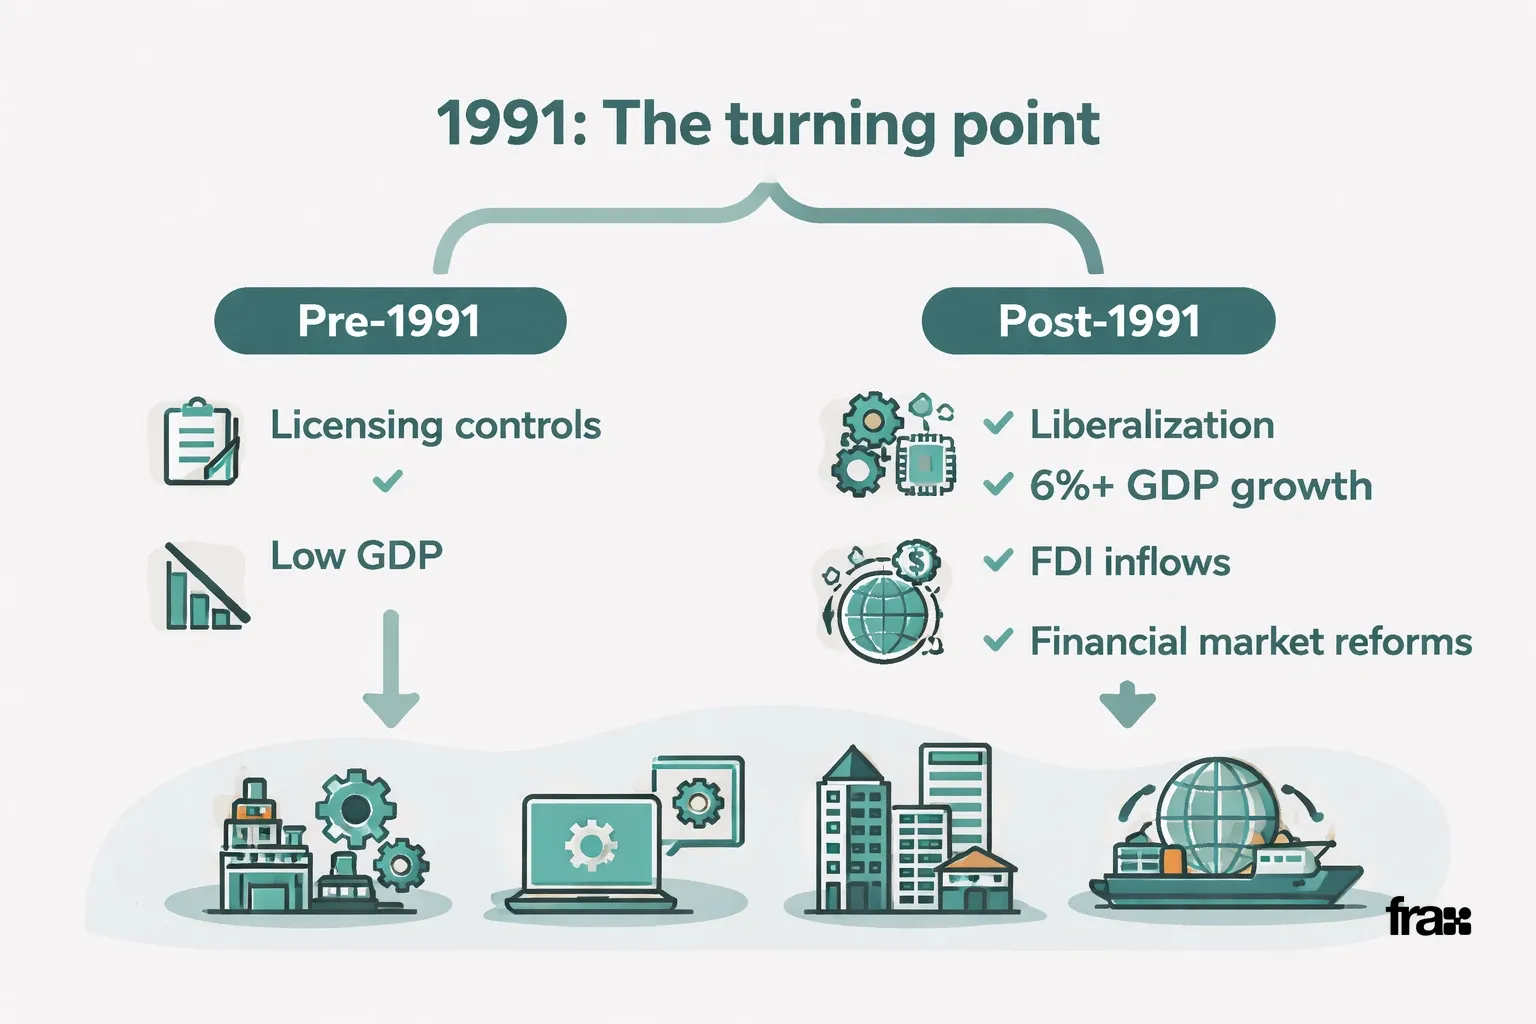
The 1991 economic reforms marked the clearest inflection point in India's growth history. A balance of payments crisis forced the government to dismantle licensing controls, open trade, and welcome foreign investment.
Liberalization unleashed private enterprise across manufacturing, services, and technology. GDP growth climbed from the 3-4% band toward 6% and higher through the 1990s. Foreign direct investment inflows, once negligible, began scaling meaningfully.
Financial markets deepened alongside the broader economy. Banking reforms, stock market modernization, and telecom expansion created new channels for capital formation. Cities like Bengaluru and Pune became service-sector hubs, driving demand for commercial and residential space.
This is where real estate started connecting more directly to GDP growth. Urban migration accelerated. Property values in emerging IT corridors began outperforming traditional metros.
This content is for informational purposes only and does not constitute financial, legal, or investment advice.
The modern acceleration: 2000 to today
This content is for informational purposes only and does not constitute financial, legal, or investment advice.
Since 2000, India's GDP growth has averaged close to 6-7% annually interrupted only by global shocks like the 2008 financial crisis and the 2020 pandemic. India became the world's fifth-largest economy by nominal GDP.
Services now contribute over half of national output, followed by industry and agriculture. Digital infrastructure, mobile penetration, financial inclusion reforms these have widened participation in formal economic activity.
Period | Approx. Annual GDP Growth | Key Driver |
|---|---|---|
1950 to 1980 | 3 to 3.5% | Public sector industrialization |
1980 to 1991 | 4 to 5% | Partial liberalization |
1991 to 2000 | 5 to 6% | Post-reform private enterprise |
2000 to 2019 | 6 to 7% | Services, IT, urbanization |
2020 to 2026 | Recovery to 6.5%+ | Digital economy, infra push |
Urbanization has been a consistent byproduct. Millions of professionals now earn salaries that were unimaginable a generation ago. Yet premium real estate still feels out of reach for many. That gap is exactly what fractional real estate investing platforms are trying to close. Investors hold direct beneficial partnership interests in dedicated LLP SPVs, not direct individual property titles.
See How You Can Start Investing With ₹10,000
Where we stand in 2026
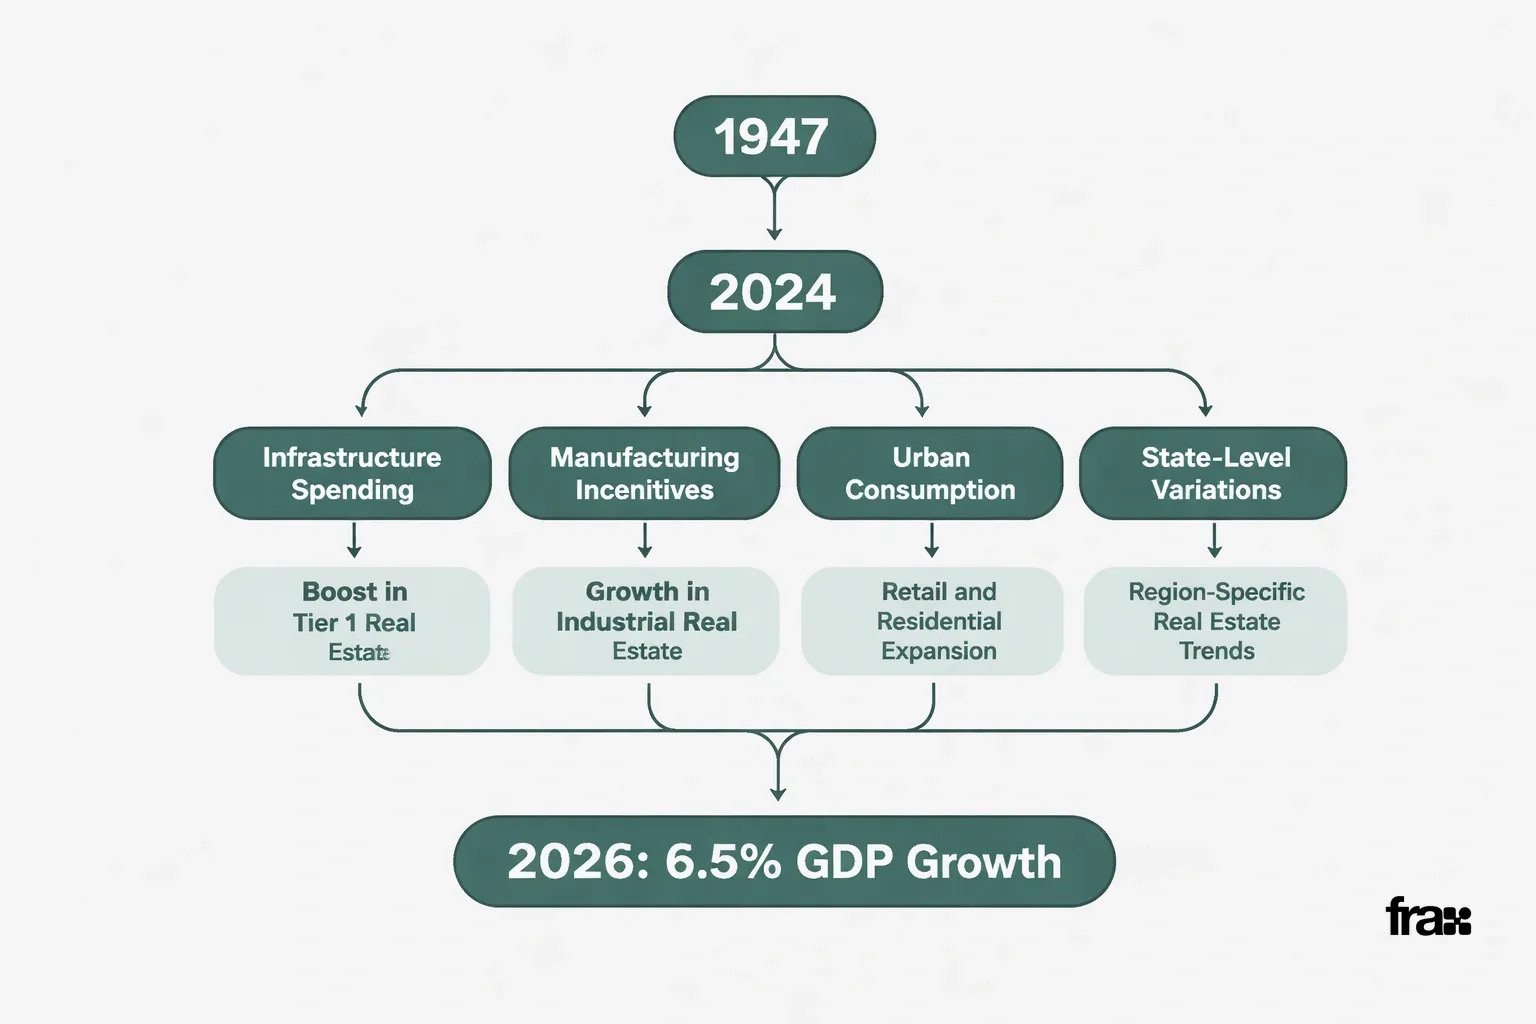
India's GDP growth in 2026 continues near the 6.5% mark. That keeps India among the fastest-growing large economies worldwide. Infrastructure spending, manufacturing incentives, and rising urban consumption remain the primary engines.
State-level performance varies significantly which matters a lot for anyone tracking property markets. Our detailed breakdown in India's State GDP Growth 2026: Real Estate Insights covers how individual states contribute to this national number and what it means for regional real estate demand.
For a broader look at how national economic momentum ties into property markets, our parent article on India's Economic Growth and Real Estate Outlook walks through the connection in more depth.
This content is for informational purposes only and does not constitute financial, legal, or investment advice.
What this means for real estate investors
India's GDP growth history shows a clear pattern: each acceleration phase created new wealth, and that wealth eventually flowed into real estate. The 1991 reforms and the post-2000 services boom both triggered property demand surges in cities that captured the growth first.
The challenge has always been access. Premium real estate historically required crores of rupees, extensive paperwork, and broker-driven deals that shut out salaried earners. Even as GDP growth lifted incomes, the entry barrier to quality property stayed largely unchanged for decades.
This is where fractional models are changing the equation. Understanding how fractional real estate investing works in India helps explain why a growing number of professionals earning ₹15-20 lakh annually are finally participating in premium property markets.
If you're new to these concepts, our beginner's glossary for fractional real estate investment in India is a useful starting point. You can also compare it against other options in our guide to REITs in India or review the top real estate investment companies operating in India.
This content is for informational purposes only and does not constitute financial, legal, or investment advice.
Explore Premium Real Estate Opportunities Today
Turning India's growth story into a personal wealth strategy
India's economic transformation since 1947 offers a simple lesson: growth compounds, and those who position early tend to benefit most. Applying that lesson today means looking beyond savings accounts toward growth-linked assets like real estate.
Cities riding the fastest wave of GDP growth particularly those covered in our guide to the best fractional real estate investment cities in India often see the earliest property demand shifts. Tracking these patterns can help investors decide where to allocate capital first.
For those ready to take the first step, our step-by-step beginner's guide to your first fractional real estate investment breaks down the process in plain language. You can also browse more resources on the FraX blog or visit the FraX homepage to learn more. If you have specific questions, reach out through our contact page.
Investors hold direct beneficial partnership interests in dedicated LLP SPVs, not direct individual property titles. Past performance and realized XIRR figures are historical and do not guarantee future property returns or rental yields.
This content is for informational purposes only and does not constitute financial, legal, or investment advice.
Common questions
What was India's GDP in 1947? Around $2.7 billion. The economy was overwhelmingly agrarian with minimal industrial output.
How much has GDP growth changed since independence? From roughly 3-3.5% annually in the early decades to around 6.5% in 2026. India is now one of the world's largest economies.
What caused the biggest jump? The 1991 reforms. Dismantling licensing controls and opening trade and investment that's the clearest turning point.
How does GDP growth affect real estate demand? Higher growth typically means higher urban incomes and migration, which drives demand for residential and commercial real estate in fast-growing cities.
Where can I read more about state-wise growth and real estate? Our article on India's State GDP Growth 2026: Real Estate Insights breaks it down by state.
Is growth-linked real estate investing risk-free? No. No investment is risk-free. Property values are influenced by many factors beyond national GDP trends. This content is for informational purposes only and does not constitute financial, legal, or investment advice.
Learn more
Discover more from the latest posts.