
India's Q1 FY27 GDP Growth at 6.7%: Implications for Real Estate
India's Q1 FY27 GDP rises 6.7% on services, construction. See impact on real estate investments and portfolio strategy in 2026.
India's Q1 FY27 GDP numbers are out. Growth came in at an estimated 6.7% for April through June 2026, according to provisional National Statistical Office data. It's a slight cooldown from the previous quarter, but India is still outpacing almost every other major economy right now, mostly thanks to services and construction holding strong.
If you track real estate or manage portfolios, these quarterly prints matter. They show where money is actually moving. Let's break down this Q1 number, what drove it, and what it means for your asset allocation in 2026.
This content is for informational purposes only and does not constitute financial, legal, or investment advice.
What is India's Q1 GDP growth rate for 2026?
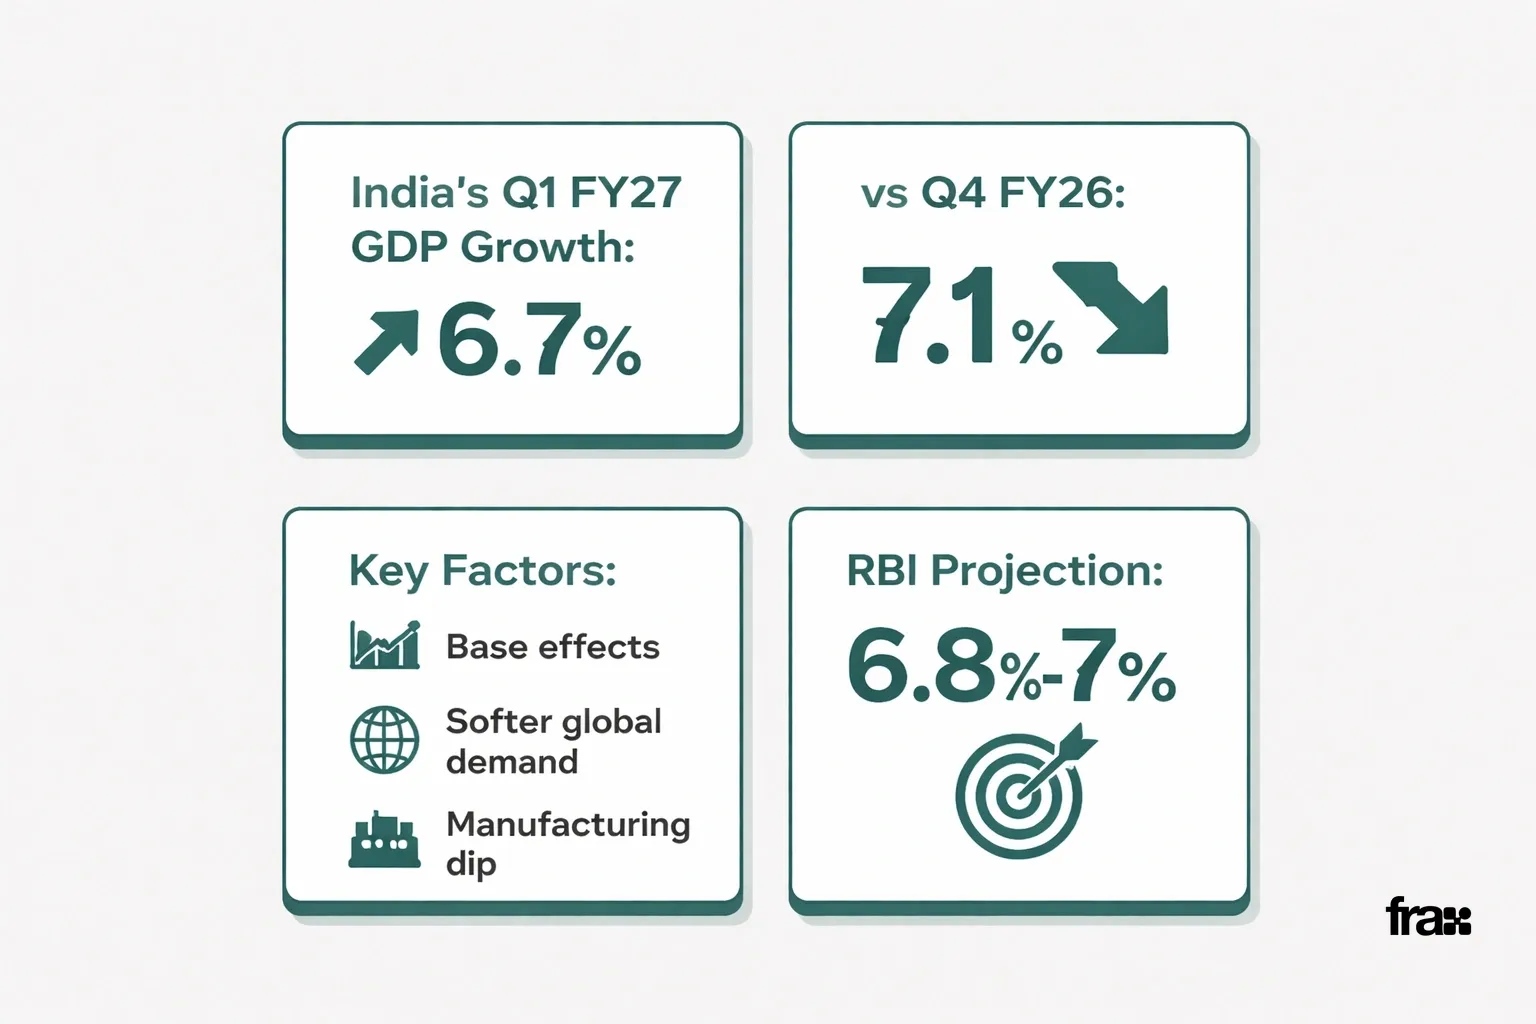
India's Q1 GDP growth rate is just the year-on-year expansion of the economy from April to June. For FY27, it's roughly 6.7%, based on provisional estimates the NSO released in late August 2026.
That's down slightly from the 7.1% we saw in Q4 FY26. Economists point to base effects, softer global demand, and a temporary dip in manufacturing. Still, 6.7% is well above the global average, and India is outpacing most G20 peers.
The Reserve Bank of India had projected Q1 FY27 growth between 6.8% and 7%, so the actual print missed by a hair. But Q1 numbers often get revised upward later as more granular data arrives, so a slight miss isn't unusual.
This content is for informational purposes only and does not constitute financial, legal, or investment advice.
How Q1 GDP data is measured and released
The NSO compiles India's Q1 GDP data using output, expenditure, and income approaches. They drop provisional estimates about 60 days after the quarter ends, then revise them months later.
They pull data from everywhere: industrial production indices, corporate earnings, agricultural surveys, and government spending records. Because India's informal economy is huge, the NSO applies statistical adjustments to guess the unorganized sector's contribution.
The typical release timeline looks like this:
Milestone | Approximate Timing |
|---|---|
Quarter ends | June 30 |
Provisional Q1 estimate | Late August |
First revised estimate | November |
Final revised estimate | Following January |
This staggered schedule means the "final" Q1 growth number for FY27 won't be locked in until early 2028. If you track the India GDP story, treat early figures as directional, not definitive.
This content is for informational purposes only and does not constitute financial, legal, or investment advice.
Sector-wise breakdown of Q1 GDP growth
Services led the pack, making up over 55% of total output expansion. Construction and financial services did well, but manufacturing slowed compared to last year's Q1.
Services grew an estimated 8.2%, driven by IT exports, financial services, and a rebound in travel and tourism.
Construction expanded around 7.4%, buoyed by infrastructure spending and residential completions.
Manufacturing grew a modest 4.1%, weighed down by export headwinds and input costs.
Agriculture posted 3.8% growth, helped by a good monsoon across key states.
Mining and quarrying grew 5.2%, reflecting steady demand from construction and manufacturing.
The construction sector's performance is the one to watch if you care about property markets. Steady construction activity usually points to broader real estate demand, especially in cities.
Q1 GDP growth rate: Historical comparison
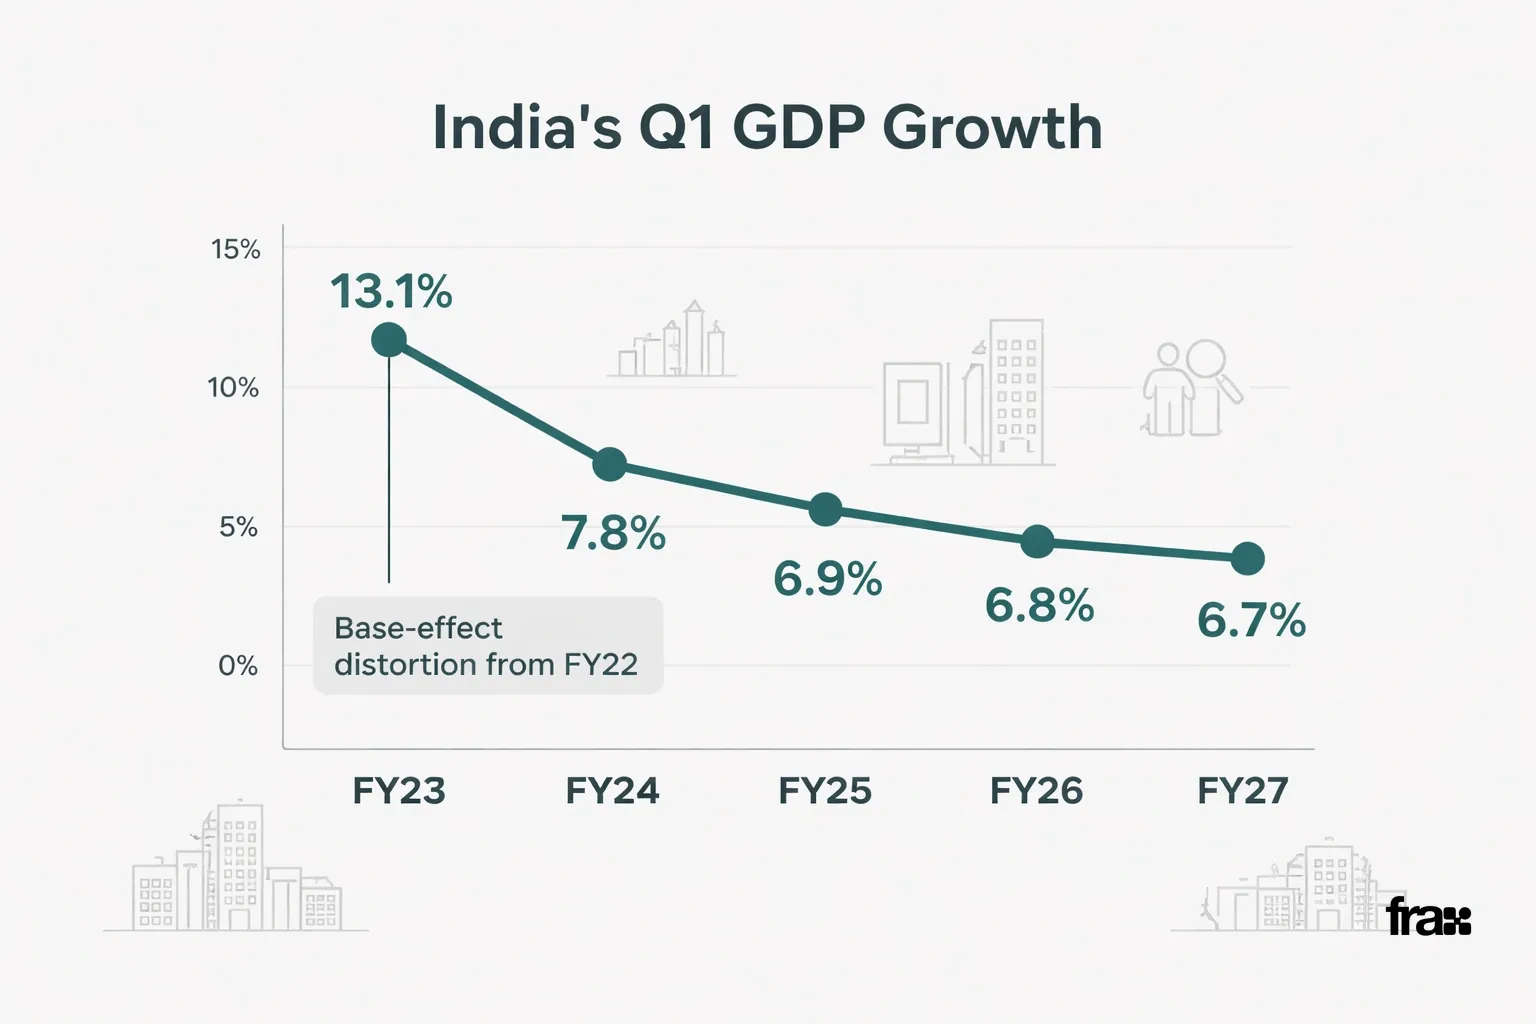
India's Q1 GDP growth rate has bounced around over the past five years, thanks to pandemic recovery, inflation cycles, and shifting global demand. Looking at recent Q1 prints shows a pattern of gradual normalization after the wild post-COVID rebound.
Fiscal Year | Q1 GDP Growth Rate |
|---|---|
FY23 | 13.1% |
FY24 | 7.8% |
FY25 | 6.9% |
FY26 | 7.5% |
FY27 (current) | 6.7% |
The FY23 spike is just a base-effect distortion from the pandemic-hit FY22. Since then, growth has settled into a more sustainable 6.5% to 7.5% band. For a deeper look at how India's economy has evolved since liberalization, our piece on India's GDP Growth 2014-2026: Real Estate Insights & Ops traces the decade-long trajectory in detail.
This content is for informational purposes only and does not constitute financial, legal, or investment advice.
What drives India's Q1 GDP growth
Several structural and cyclical factors shape India's Q1 GDP growth rate. Government capital expenditure, private consumption, export performance, and monsoon outcomes all dictate quarterly momentum.
Government capex has been a consistent tailwind. Infrastructure spending on roads, railways, and urban housing projects has kept construction activity elevated. Private consumption, nearly 60% of GDP, remains sensitive to inflation and interest rates.
Exports faced pressure in Q1 FY27 due to softer demand from key trading partners. This explains the manufacturing slowdown. Meanwhile, a normal monsoon supported agricultural output and rural incomes, cushioning overall growth.
Interest rate policy also matters. The RBI held the repo rate steady through most of Q1 FY27, keeping borrowing costs stable for businesses and consumers. This stability likely supported services and construction specifically.
This content is for informational purposes only and does not constitute financial, legal, or investment advice.
See How GDP Trends Shape Smart Real Estate Choices
Why Q1 GDP growth matters for real estate investors
India's Q1 GDP growth rate directly influences real estate demand, rental income potential, and property values. Construction sector performance within the GDP print offers an early signal of building activity and housing market health.
A steady 6.7% growth rate, even with mild moderation, suggests the broader economy remains supportive of real estate investment. Construction growing at 7.4% in Q1 indicates ongoing project completions and continued urban development momentum.
State-level variations matter too. Some states consistently outperform the national GDP average, which often translates into stronger local property markets. Our detailed breakdown in India's State GDP Growth 2026: Real Estate Insights covers which regions are pulling ahead and why that matters for portfolio decisions.
It's also worth understanding how growth slowdowns, even temporary ones, can affect investment strategy. Our piece on India's 2026 Economic Slowdown: Real Estate Insights & Strategies walks through practical approaches for navigating softer quarters without panic.
For a broader historical view connecting India's economic evolution to real estate outcomes, the parent guide on India's Economic Growth and Real Estate Outlook ties all these threads together.
This content is for informational purposes only and does not constitute financial, legal, or investment advice.
How investors can respond to GDP growth signals
This content is for informational purposes only and does not constitute financial, legal, or investment advice.
Investors can respond to India's GDP growth signals by diversifying across asset classes and geographies rather than reacting to single-quarter fluctuations. GDP data works best as a directional tool, not a precise timing mechanism for individual investment decisions.
A few things to keep in mind:
Track multiple quarters, not one. A single Q1 print rarely tells the full story. Compare it against prior quarters and revised estimates.
Watch sector-specific data. Construction and services growth often matter more for real estate decisions than headline GDP alone.
Diversify geographically. Since state-level growth varies widely, spreading investments across multiple cities can reduce concentration risk.
Consider lower-ticket entry points. Platforms enabling fractional ownership let investors participate in premium real estate starting at ₹10,000, without needing to time the market perfectly. Investors hold direct beneficial partnership interests in dedicated LLP SPVs, not direct individual property titles.
Stay informed on liquidity options. Understanding how and when you can exit an investment matters as much as entry timing.
For those newer to structured real estate investing, our guide on Fractional Real Estate Investing in India: How It Works explains the mechanics in plain language. And if you're weighing REITs against other structures, the Investing in REITs in India: A Beginner's Guide offers a useful comparison point.
Start Building a Diversified Real Estate Portfolio Today
Staying ahead of future GDP releases
India's next major GDP release, covering Q2 FY27, is expected in late November 2026. Tracking these quarterly prints alongside sector data helps investors build a more complete picture of economic momentum over time.
Keep in mind that provisional numbers get revised. The Q1 FY27 figure of 6.7% could shift once final estimates arrive in 2028. Treating each release as one data point within a longer trend, rather than a standalone verdict, leads to better-informed decisions.
For readers wanting the full arc of India's growth story, from independence-era planning to today's fintech-driven investment landscape, our long-form piece on India's GDP Growth Journey 1947-2026 & Real Estate Insights offers useful historical context. And for city-specific opportunities tied to strong local economic performance, check out Top 10 Best Places to Invest in India 2026.
This content is for informational purposes only and does not constitute financial, legal, or investment advice. Investors hold direct beneficial partnership interests in dedicated LLP SPVs, not direct individual property titles. Past performance and realized XIRR figures are historical and do not guarantee future property returns or rental yields.
Frequently Asked Questions
This content is for informational purposes only and does not constitute financial, legal, or investment advice.
What was India's Q1 GDP growth rate for FY27? India's provisional Q1 FY27 GDP growth rate stood at approximately 6.7%, based on National Statistical Office data released in late August 2026.
Why did Q1 GDP growth slow compared to the previous quarter? The moderation was largely due to base effects, softer export demand, and a temporary slowdown in manufacturing output, even as services and construction remained resilient.
How often is India's Q1 GDP data revised? The NSO releases a provisional estimate first, followed by a first revision around November and a final revision roughly 18 months after the quarter ends.
Which sector contributed most to Q1 GDP growth? Services led the way, growing an estimated 8.2%, followed by construction at around 7.4%, reflecting steady infrastructure and urban development activity.
Does India's Q1 GDP growth rate directly predict real estate prices? Not directly. GDP growth is one of several indicators, and it works best when viewed alongside state-level trends, construction sector data, and local market conditions.
Where can I learn more about how GDP trends connect to real estate strategy? The parent guide, India's Economic Growth and Real Estate Outlook, along with related pieces on state-wise growth and economic slowdown strategies, offers deeper context.
Learn more
Discover more from the latest posts.


