
India's GDP Growth 2014-2026: Real Estate Insights & Ops
Explore India's rapid GDP growth from 2014 to 2026 and its impact on real estate demand, urbanization, and investment opportunities.
India was the 10th largest economy in 2014. Nominal GDP: roughly $2.04 trillion. By September 2026, it's projected to sit among the top five. A decade-long climb from 10th to 5th is unusually fast for an economy of this scale.
If you're tracking India's economic story or wondering where real estate demand is headed this ranking shift is worth understanding. It's not just a number. It's a signal about what's happened to incomes, urbanization, and capital flows over the last ten years.
This content is for informational purposes only and does not constitute financial, legal, or investment advice.
India's GDP Ranking in 2014: The Starting Point
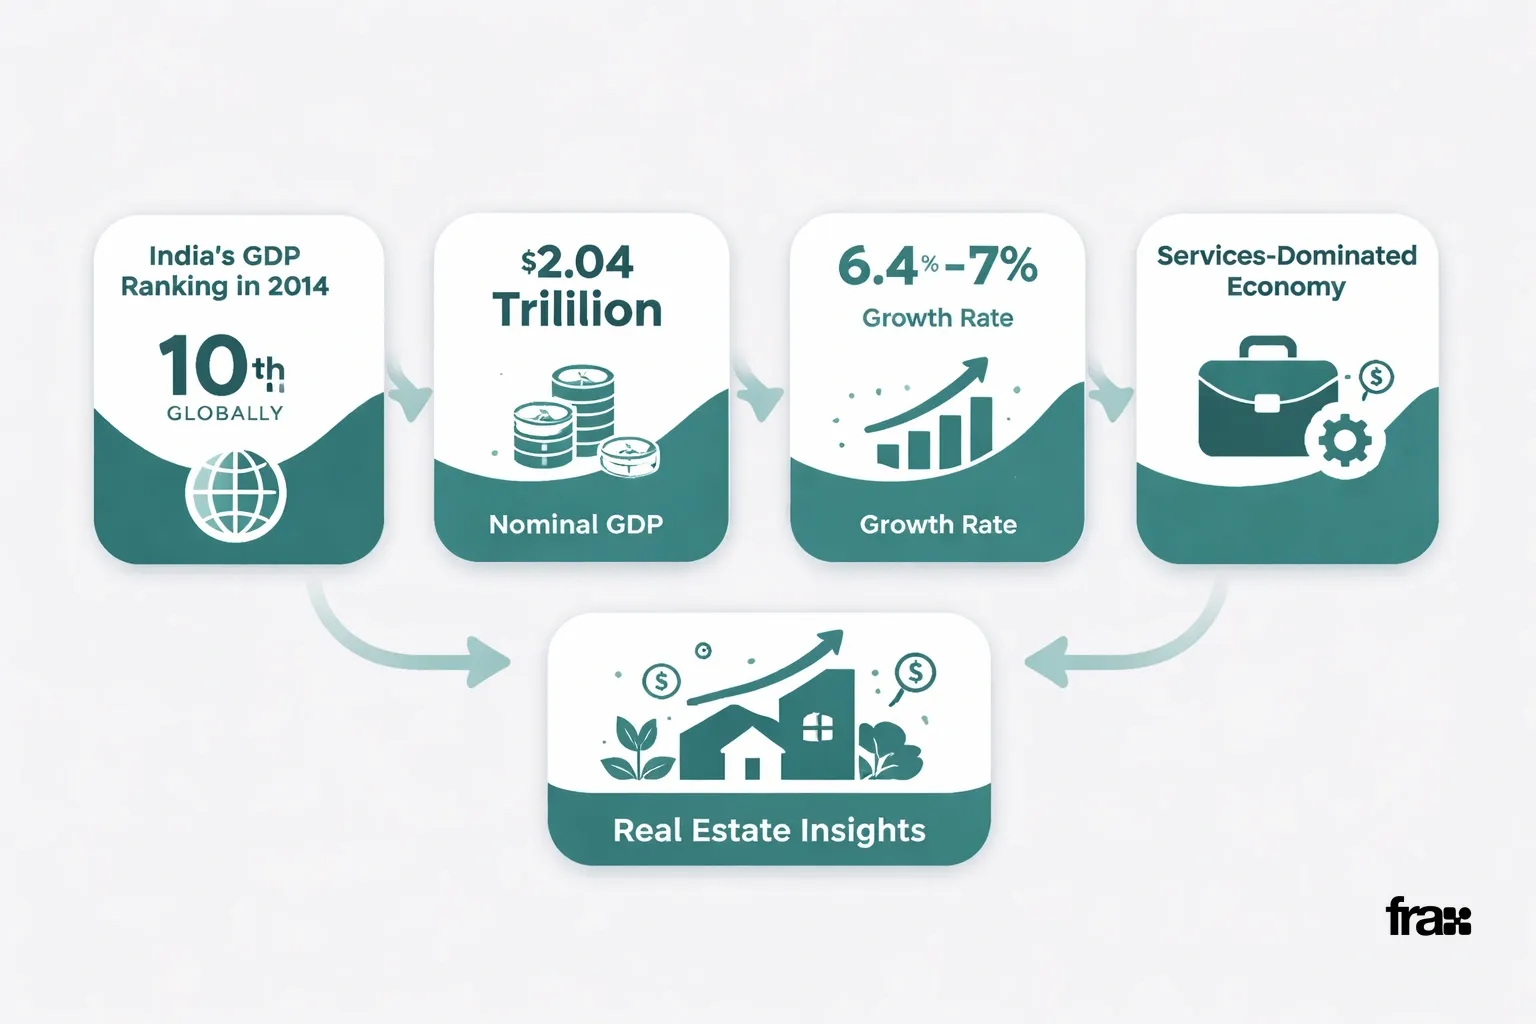
In 2014, India ranked 10th globally by nominal GDP, behind Italy, Brazil, and Russia. World Bank data puts the economy at around $2.04 trillion that year.
The economy was still finding its footing after a sluggish 2012-2013. Inflation was running high, the rupee had taken a hit, and foreign investors were wary. The 2014 election brought in a government that talked reform, infrastructure, and ease of doing business.
The baseline looked like this:
Nominal GDP: ~$2.04 trillion
Global rank: 10th
Growth rate: 6.4%-7% for the fiscal year
Economy heavily weighted toward services, with agriculture and manufacturing lagging
For the full historical arc 1947 to now the companion piece on India's GDP Growth Journey 1947-2026 & Real Estate Insights covers it in detail.
This content is for informational purposes only and does not constitute financial, legal, or investment advice.
What Pushed GDP Growth After 2014
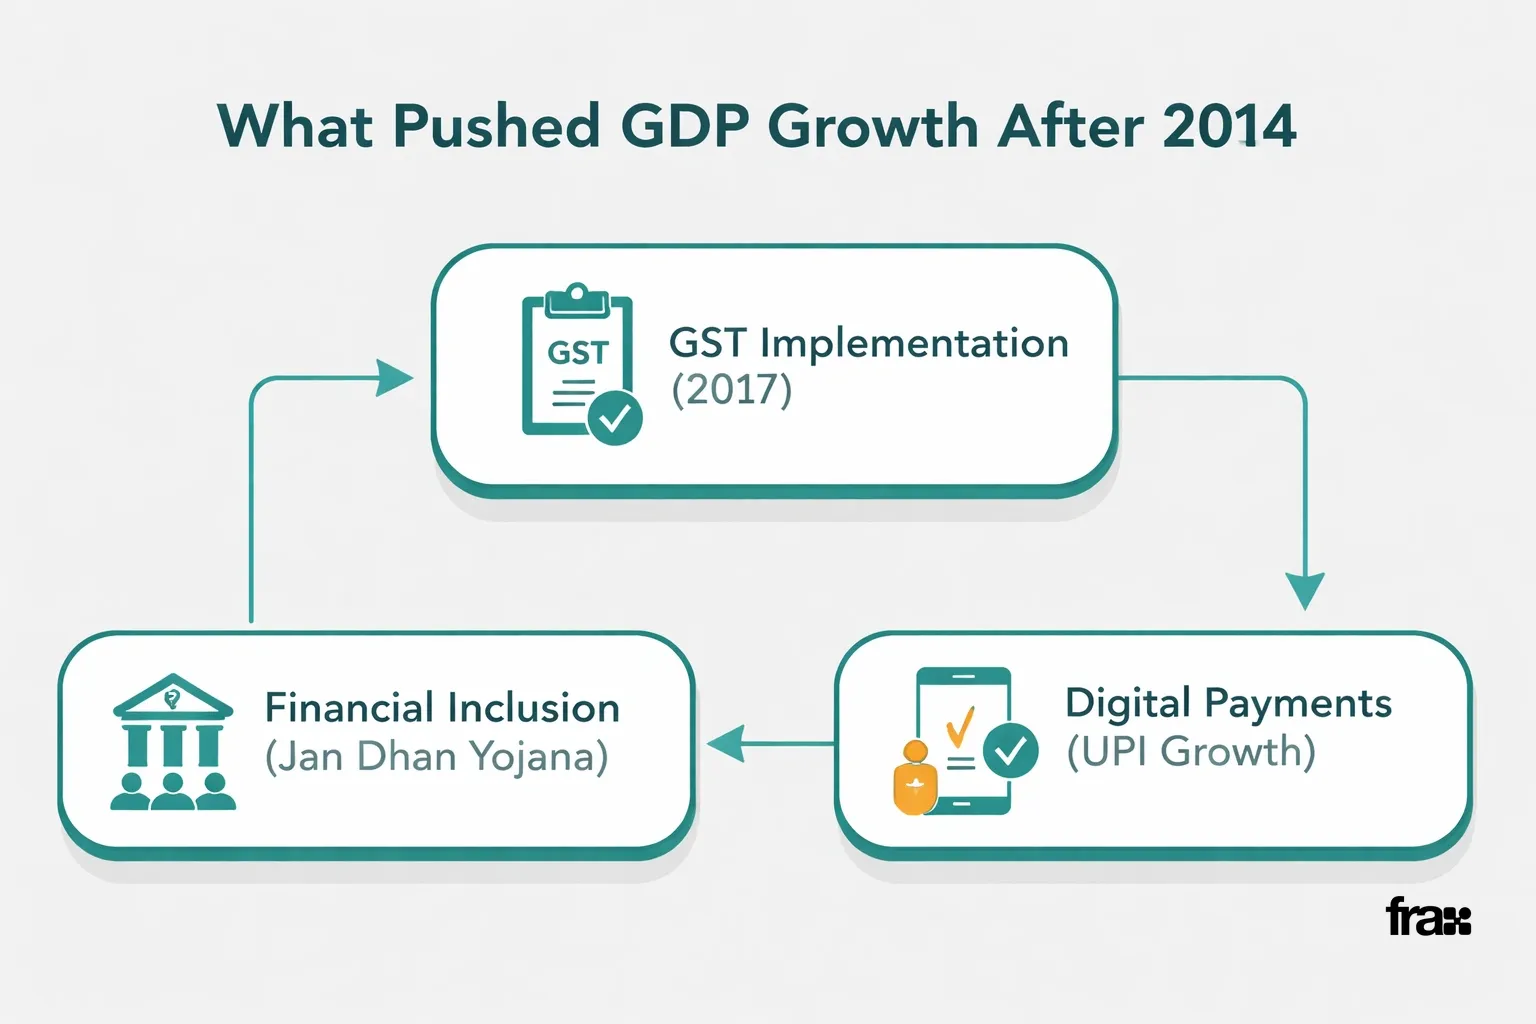
Growth didn't accelerate by accident. A few big shifts mattered:
GST (2017) replaced a tangle of state and central taxes with a unified system. Implementation was messy, but the long-term effect was simpler compliance and easier interstate movement of goods.
Financial inclusion. Jan Dhan Yojana opened bank accounts for hundreds of millions of people. Many were first-time account holders. This didn't directly boost GDP, but it pulled informal savings into the formal system and made direct benefit transfers possible.
Digital payments. UPI adoption exploded. Transaction volumes went from millions to billions. This reduced friction in the economy: small businesses could accept digital payments, and cash dependency dropped.
Infrastructure spending. Highways, ports, airports, and renewable energy projects all saw increased investment. The effects show up in logistics efficiency and power availability.
Startups. The ecosystem grew from a niche to a meaningful part of the economy. New sectors fintech, edtech, SaaS added to GDP composition.
Demographics helped too. A large young workforce meant more workers, more consumption, and more demand for housing and services. The dividend is still playing out, especially in tier 1 and tier 2 cities.
This content is for informational purposes only and does not constitute financial, legal, or investment advice.
See How Growing Cities Are Creating Real Estate Opportunity
Ranking Shift, Year by Year
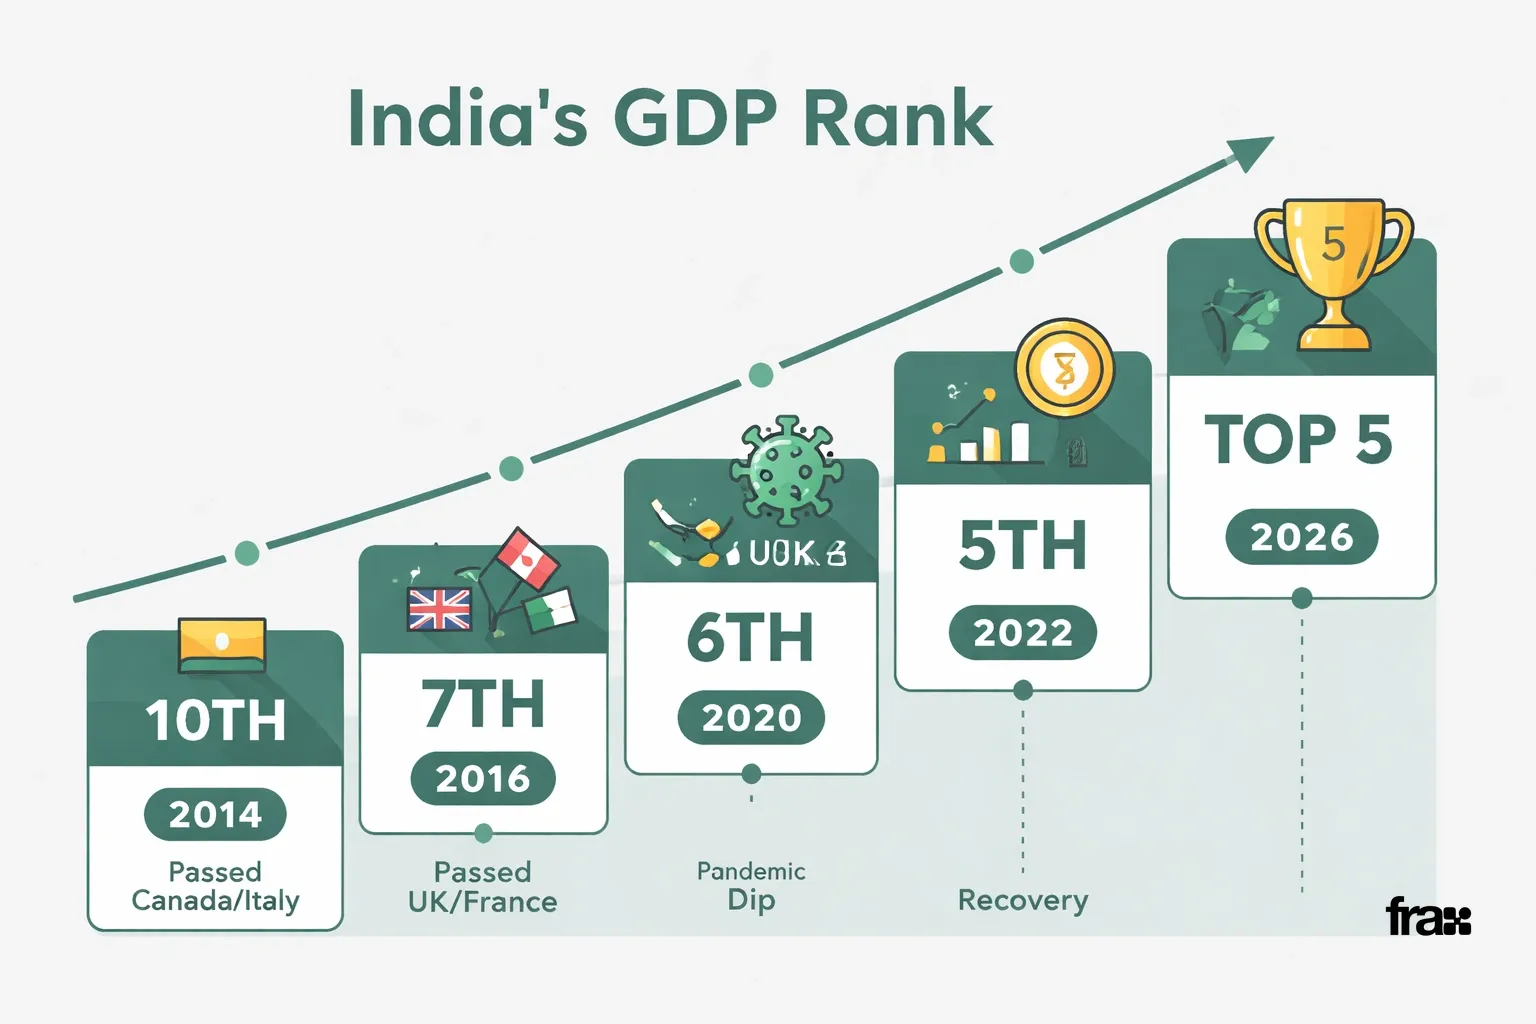
India climbed almost every year since 2014. By 2019, it had passed France and the UK to crack the top five.
Year | Rank | What Happened |
|---|---|---|
2014 | 10th | Starting point |
2016 | 7th | Passed Canada and Italy |
2019 | 5th | Passed UK and France |
2020 | 6th | Pandemic dip |
2022 | 5th | Recovery |
2026 | Top 5 | Holding |
These are approximate ranks based on nominal GDP. Currency swings and data revisions can shift the numbers slightly, but the direction is clear: India kept climbing, even through a global shock.
For state-level breakdowns, see India's State GDP Growth 2026: Real Estate Insights.
This content is for informational purposes only and does not constitute financial, legal, or investment advice.
Why the Ranking Climb Matters for Real Estate
GDP growth and real estate are linked, but not in a simple way. It's not "GDP up 7% means property prices up 7%."
What actually happens: a larger economy means more people earning formal salaries, more urban migration, more households crossing the income threshold where buying property becomes thinkable. The segment earning ₹15-20 lakh annually has grown substantially since 2014. They're not buying land, but they are looking at apartments in growing cities.
This is also why fractional ownership has gained traction. Incomes rose, but property prices in premium areas rose faster. The gap between what someone can save and what a full property costs widened. Fractional models let people invest in real estate tied to this growth without needing crores upfront.
If you're new to this, the explainer on Fractional Real Estate Investing in India: How It Works is a good starting point.
This content is for informational purposes only and does not constitute financial, legal, or investment advice.
Start Building Your Real Estate Portfolio Today
What GDP Growth in 2026 Looks Like
Forecasts for FY2026-27 put growth at 6%-7%. That's slower than the 8%-9% peaks, but still faster than almost any other large economy. If current trends hold, India could move into the top three within a few years depending on currency and how other economies perform.
For investors, a few practical points:
Growth isn't evenly distributed. Some cities and states are growing much faster than others.
Urban real estate demand tends to track income growth and job creation, not just national GDP.
Diversification across cities matters more as growth spreads beyond the biggest metros.
Long-term expectations should factor in growth cycles, not just a straight line up.
For a broader view, the pillar article on India's Economic Growth and Real Estate Outlook goes beyond rankings. If you're considering your first investment, the step-by-step guide and glossary cover the basics. For comparing structures, see the REIT investing guide.
This content is for informational purposes only and does not constitute financial, legal, or investment advice. Investors hold direct beneficial partnership interests in dedicated LLP SPVs, not direct individual property titles. Past performance and realized XIRR figures are historical and do not guarantee future property returns or rental yields.
Q: Where did India rank in 2014? 10th. Nominal GDP was about $2.04 trillion.
Q: What changed the ranking? GST, financial inclusion, digital payments, infrastructure spend, and demographic demand. Growth averaged 6%-8% in most years.
Q: Did the ranking ever drop? Briefly in 2020, during the pandemic. It recovered by 2022.
Q: How does this connect to real estate? Higher GDP: more formal jobs: more households with property-buying income. Demand shifts to cities where those jobs are concentrated.
Q: Where can I read more? The main pillar on India's Economic Growth and Real Estate Outlook and the 1947-2026 historical piece cover the longer arc.
Learn more
Discover more from the latest posts.


