
India's Q1 GDP Growth: Economic Momentum & Real Estate Impact
Explore India's Q1 GDP growth, its economic implications, and real estate market impacts. Understand trends and sector contributions.
India's Q1 GDP growth measures how fast the economy expanded between April and June, the opening quarter of the financial year. The National Statistical Office (NSO) calculates it year-on-year, comparing the quarter against the same three months a year earlier. It's one number, and the market chews on it for months.
Most of that attention is about timing. Q1 arrives before anything else, so it sets expectations for the whole fiscal year. A strong print usually means consumers are spending, companies are investing, or the government is putting money to work. Often it's all three at once. A weak print raises questions, and those questions don't really go away until the next quarterly release answers them.
This content is for informational purposes only and does not constitute financial, legal, or investment advice.
What exactly counts as Q1 GDP growth
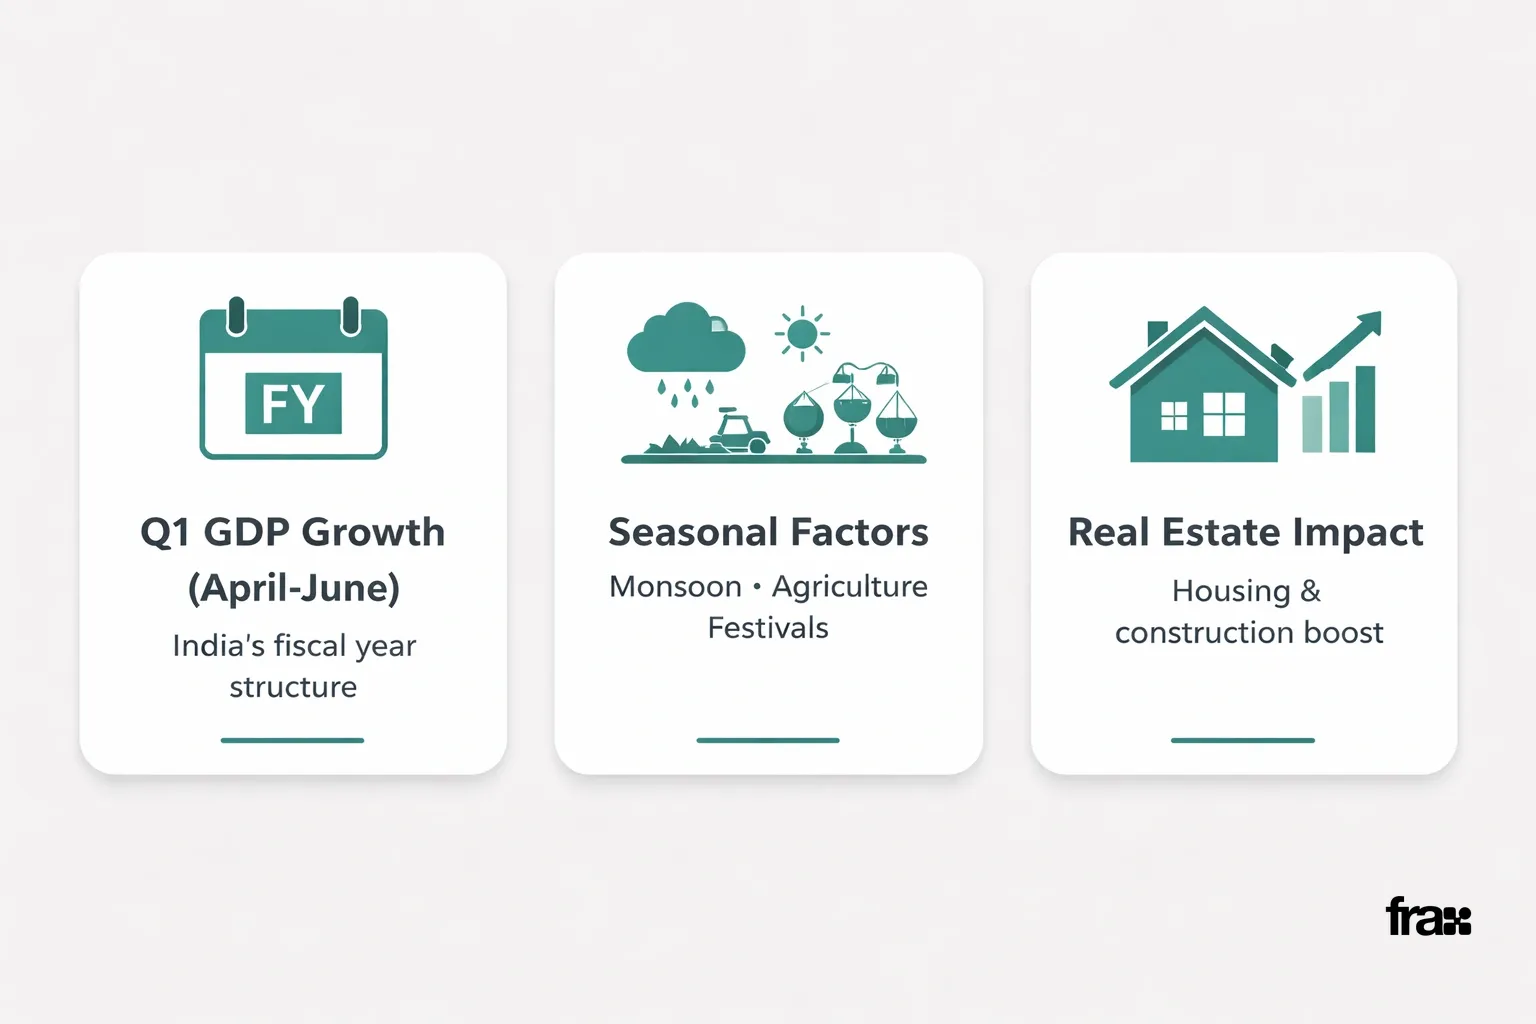
Q1 is the three months from April to June, the opening quarter of a financial year that runs April to March. Most other economies track GDP on the calendar year. India doesn't, and the difference shapes how this number behaves.
Because the fiscal year is built this way, Q1 always lands in summer. Monsoon activity, agricultural output, and pre-festive demand all get baked into the same three-month window, so the quarter carries seasonal quirks the other three don't. Analysts adjust for this when comparing quarters, but it helps to know the quirks are there.
The NSO releases provisional estimates roughly two months after the quarter ends, expressed as a percentage change over the same quarter the previous year. There are always two versions: the provisional estimate built on partial data, and a revised figure that lands months later once the complete numbers are in. If you follow India's GDP growth trends, treat the early prints as directional, not final.
This content is for informational purposes only and does not constitute financial, legal, or investment advice.
How Q1 GDP growth has moved over recent years
The recent pattern is easy to spot once you know what you're looking at: one spike, then a settle. Here are the Q1 readings across recent financial years, based on publicly reported NSO estimates for the April-June period.
Financial Year | Q1 Growth (Approx.) |
|---|---|
FY23 (Apr-Jun 2022) | 13.1% |
FY24 (Apr-Jun 2023) | 7.8% |
FY25 (Apr-Jun 2024) | 6.7% |
FY26 (Apr-Jun 2025) | 7.8% |
FY27 (Apr-Jun 2026) | 6.7% |
About that 13.1% in FY23: it says more about 2021 than about 2022. The reading came against a pandemic-disrupted base a year earlier, which flattered it enormously. The years since settled into a far more believable 6.7% to 7.8% range. It's also why economists check the base quarter first. Most headline surprises die right there.
If you want the full breakdown of the latest print and what it means for property markets, India's Q1 FY27 GDP growth at 6.7% and its real estate implications covers that quarter in detail.
Sector contributions behind the Q1 number
Every Q1 figure gets assembled from the same four sectors: agriculture, manufacturing, services, and construction. How each performs between April and June depends heavily on the season.
Services is usually the workhorse, contributing the largest single share of Q1 growth. Manufacturing reflects the order books carried over from the previous quarter, and it stays sensitive to input costs and export demand through the summer. Agriculture depends almost entirely on how the pre-monsoon and early monsoon rains behave, because summer sowing happens in this window. Construction typically dips relative to its winter peak and picks back up in Q3 and Q4.
Curious how one sector shapes national output across the whole year? India's primary sector and its GDP impact unpacks agriculture's role in detail.
Why the first quarter sets the tone
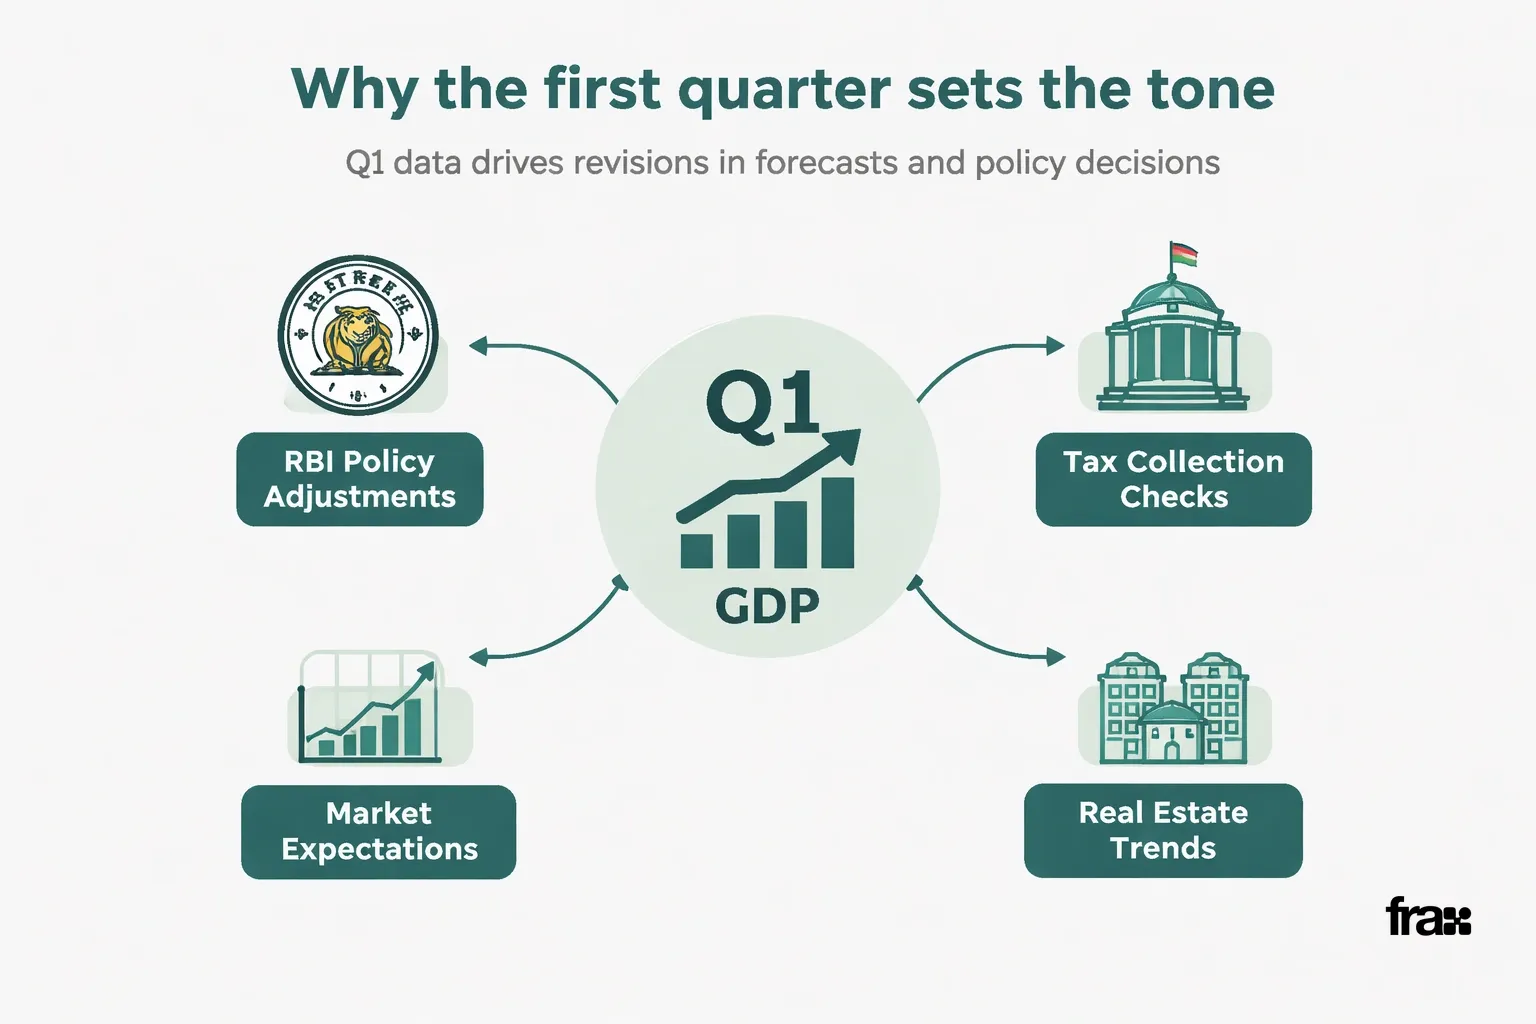
Q1 arrives before the other three quarters, so everyone leans on it: markets, rating agencies, the RBI. A surprise in either direction usually triggers revisions to full-year growth forecasts within days.
The RBI references Q1 data when reviewing its own growth projections at monetary policy meetings. Government departments use the same figure to check whether tax collection and spending targets are still on track. And anyone who has sat through earnings season in July or August knows how often management leans on Q1 GDP trends to explain demand.
That's how a single quarter ends up mattering well beyond its own three months. It becomes the reference point everyone cites in budget discussions, investment reports, and sector outlooks for the rest of the year.
This content is for informational purposes only and does not constitute financial, legal, or investment advice.
Explore How Economic Growth Shapes Real Wealth on FraX
Reading Q1 GDP growth the right way
Never read a Q1 print in isolation. The number only means something next to its base quarter and its revision history, and analysts who have been burned before usually wait for at least one revision before committing to a firm view.
A few habits make this easier. Check whether the previous year's Q1 was unusually high or low; that alone explains most surprises. Compare the provisional figure against what the research desks at the big banks were expecting. Then wait for the second advance estimate before treating any number as settled.
For the long arc, India's GDP growth journey from 1947 to 2026 puts recent Q1 trends inside a much larger historical story.
This content is for informational purposes only and does not constitute financial, legal, or investment advice.
Comparing Q1 across financial years
One quarter on its own tells you very little. Line up three or more consecutive Q1 readings and you can finally tell whether the economy is accelerating, plateauing, or slowing down. The multi-year view filters out the seasonal noise and statistical blips that a lone print can't.
The practical version is a checklist you run every time a new Q1 number drops:
Is the growth rate above or below the five-year Q1 average?
Did the base quarter distort the year-on-year comparison?
Do the underlying sector contributions actually support the headline?
If the headline and the sector data disagree, trust the sector data.
Investors tracking the bigger macro story over the last decade will find India's GDP growth between 2014 and 2026 useful too, since it places these quarterly swings inside a longer growth cycle.
What this means for everyday investors
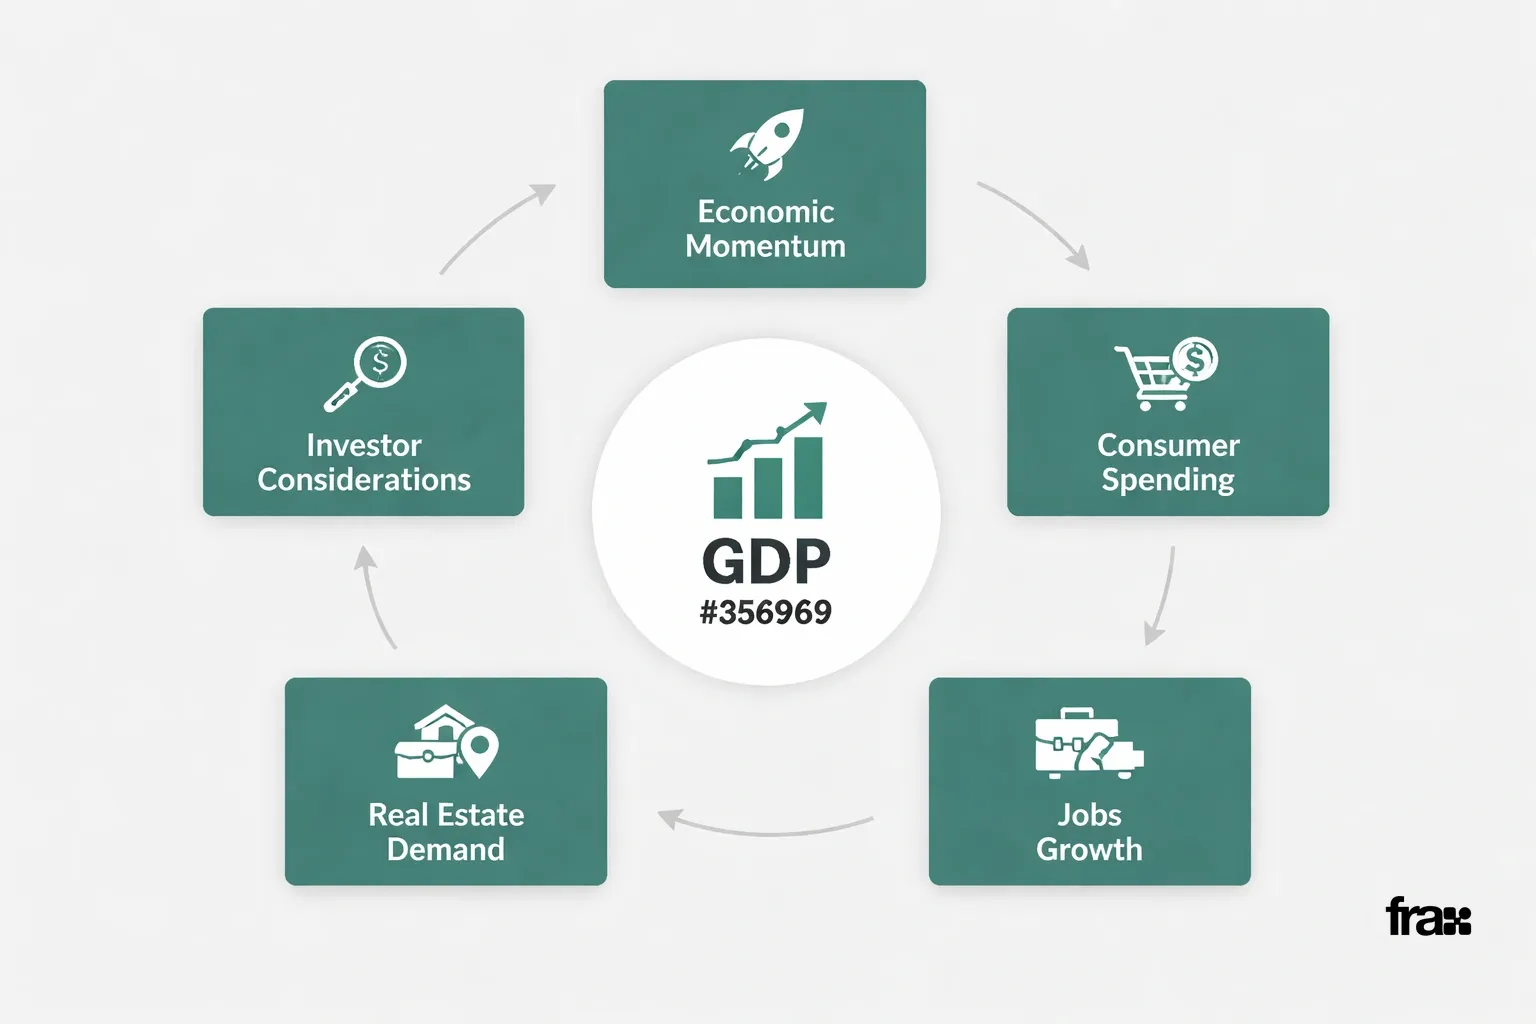
Q1 GDP growth is a useful gauge of economic momentum if you're building a long-term portfolio, though an imperfect one. Strong national output growth generally supports consumer spending and jobs, and it lifts demand for assets across cities. A weaker print is less a reason to panic and more a prompt to dig into sector-specific trends before committing to anything.
FraX was built with this bigger picture in mind. The minimum ticket size is ₹10,000, a long way below the crores traditionally needed for premium real estate. Each property on the platform sits inside its own dedicated LLP SPV, and transactions run through an ICICI Bank escrow account, with Universal Trustees overseeing the process as an independent trustee. Investors hold direct beneficial partnership interests in these LLP SPVs, not individual property titles.
If you're weighing how national growth data connects to your own portfolio, the step-by-step beginner's guide to a first fractional real estate investment walks through everything from account setup to first purchase.
This content is for informational purposes only and does not constitute financial, legal, or investment advice.
Start Building Your Portfolio With FraX Today
Key sources and where to track this data
The official release comes from the Ministry of Statistics and Programme Implementation, which publishes the quarterly estimates. RBI bulletins and the Economic Survey lean on the same figures extensively. Cross-checking a couple of sources takes an extra minute, and it saves you from anchoring on a number that might get revised.
Want to see how quarterly GDP movements map onto state-level performance? India's state-wise GDP growth trends breaks down how different regions contribute to the national figure. And if softer growth phases are what worry you, the analysis on navigating India's 2026 economic slowdown is useful context.
All of this sits inside the broader cluster on India's economic growth and real estate outlook, which ties together GDP trends, state performance, and sector-level shifts across the economy.
Past performance and realized XIRR figures are historical and do not guarantee future property returns or rental yields. This content is for informational purposes only and does not constitute financial, legal, or investment advice.
Frequently asked questions
This content is for informational purposes only and does not constitute financial, legal, or investment advice.
Q: What exactly does Q1 GDP growth measure in India? A: The year-on-year percentage change in national output during April to June, the first quarter of India's financial year, as reported by the National Statistical Office.
Q: Why does Q1 data get revised later? A: The first release is a provisional estimate built on partial data. The NSO issues revised figures once complete tax, production, and trade data come in.
Q: How is Q1 different from other quarters in India's GDP cycle? A: Q1 falls in the summer and early monsoon period, which affects agricultural output and construction activity differently than the winter quarters.
Q: Does a strong Q1 number guarantee a strong full financial year? A: No. Q1 sets an early tone, but the remaining quarters can and do change the overall trajectory.
Q: Where can I read about the most recent Q1 print in detail? A: The dedicated post on India's Q1 FY27 GDP growth at 6.7% and its real estate implications covers the latest quarter specifically.
Q: How does GDP growth data relate to platforms like FraX? A: Broader economic momentum can influence real estate demand trends, which is why FraX users often track macro indicators alongside property-specific research before allocating capital through the platform.
Learn more
Discover more from the latest posts.


